Table of Contents
Can You Drink Tap Water in San Francisco?
Yes, San Francisco's tap water is generally considered safe to drink as San Francisco has no active health based violations of the Safe Drinking Water Act (SDWA) that we are aware of. Other factors such as lead piping in a home, or low levels of pollutants on immunocompromised individuals, should also be considered, however. For the latest updates on San Francisco water, please check out its Twitter page
According the EPA’s ECHO database, from Oct. 31, 2018 to Dec. 31, 2021, San Francisco's water utility, Sfpuc City Distribution Division, had 0 violations of the Safe Drinking Water Act. For more details on the violations, please see our violation history section below. This assessment is based on the Sfpuc City Distribution Division water system, other water systems in the city may have different results.
While tap water that meets the EPA health guidelines generally won’t make you sick to your stomach, it can still contain regulated and unregulated contaminants present in trace amounts that could potentially cause health issues over the long-run. These trace contaminants may also impact immunocompromised and vulnerable individuals.
The EPA is reviewing if it’s current regulations around pollutant levels in tap water are strict enough, and the health dangers posed by unregulated pollutants, like PFAS.
Water Quality Report for San Francisco Tap Water
The most recent publicly available numbers for measured contaminant levels in San Francisco tap water are in its 2020 Water Quality Report. As you can see, there are levels which the EPA considers to be acceptable, but being below the maximum allowable level doesn’t necessarily mean the water is healthy.
Lead in tap water, for example, is currently allowed at up to 15ppb by the EPA, but it has set the ideal goal for lead at zero. This highlights how meeting EPA standards doesn’t necessarily mean local tap water is healthy.
EPA regulations continue to change as it evaluates the long term impacts of chemicals and updates drinking water acceptable levels. The rules around arsenic, as well as, lead and copper are currently being re-evaluated.
There are also a number of "emerging" contaminants that are not currently. For example, PFAS (Per- and polyfluoroalkyl substances), for which the EPA has issued a health advisory. PFAS are called "forever chemicals" since they tend not to break down in the environment or the human body and can accumulate over time.
We recommend looking at the contaminants present in San Francisco's water quality reports, or getting your home's tap water tested to see if you should be filtering your water.
San Francisco Tap Water Safe Drinking Water Act Violation History - Prior 10 Years
Below is a ten year history of violations for the water system named Sfpuc City Distribution Division for San Francisco in California. For more details please see the "What do these Violations Mean?" section below.
Is there Lead in San Francisco Water?
Based on the EPA’s ECHO Database, 90% of the samples taken from the San Francisco water system, Sfpuc City Distribution Division, between sample start date and sample end date, were at or below, 0.006 mg/L of lead in San Francisco water. This is 40.0% of the 0.015 mg/L action level. This means 10% of the samples taken from San Francisco contained more lead.
While San Francisco water testing may have found 0.006 mg/L of lead in its water, that does not mean your water source has the same amount. The amount of lead in water in a city can vary greatly from neighborhood to neighborhood, or even building to building. Many buildings, particularly older ones, have lead pipes or service lines which can be a source of contamination. To find out if your home has lead, we recommend getting you water tested.
No amount of lead in water is healthy, only less dangerous. As lead accumulates in our bodies over time, even exposure to relatively small amounts can have negative health effects. For more information, please check out our Lead FAQ page.
Are there PFAS in San Francisco Tap Water?
Currently, testing tap water for PFAS isn’t mandated on a national level. We do have a list of military bases where there have been suspected or confirmed leaks. There appears to be at least one military base - Naval Station Treasure Island - near San Francisco with suspected leaks.
With many potential sources of PFAS in tap water across the US, the best information we currently have about which cities have PFAS in their water is this ewg map, which you can check to see if San Francisco has been evaluated for yet.
Our stance is better safe than sorry, and that it makes sense to try to purify the tap water just in case.
What do these Violations Mean?
Safe Drinking Water Act Violations categories split into two groups, health based, and non-health based. Generally, health based violations are more serious, though non-health based violations can also be cause for concern.
Health Based Violations
- Maximum contaminant levels (MCLs) - maximum allowed contaminant level was exceeded.
- Maximum residual disinfectant levels (MRDLs) - maximum allowed disinfectant level was exceeded.
- Other violations (Other) - the exact required process to reduce the amounts of contaminants in drinking water was not followed.
Non-Health Based Violations
- Monitoring and reporting violations (MR, MON) - failure to conduct the required regular monitoring of drinking water quality, and/or to submit monitoring results on time.
- Public notice violations (Other) - failure to immediately alert consumers if there is a serious problem with their drinking water that may pose a risk to public health.
- Other violations (Other) - miscellaneous violations, such as failure to issue annual consumer confidence reports or maintain required records.
SDWA Table Key
Field | Description |
---|---|
Compliance Period | Dates of the compliance period. |
Status |
Current status of the violation.
|
Health-Based? | Whether the violation is health based. |
Category Code |
The category of violation that is reported.
|
Code | A full description of violation codes can be accessed in the SDWA_REF_CODE_VALUES (CSV) table. |
Contaminant Code | A code value that represents a contaminant for which a public water system has incurred a violation of a primary drinking water regulation. |
Rule Code |
Code for a National Drinking Water rule.
|
Rule Group Code |
Code that uniquely identifies a rule group.
|
Rule Family Code |
Code for rule family.
|
For more clarification please visit the EPA's data dictionary.
What do people in San Francisco think about the tap water?
The city’s tap water is not only drinkable but of excellent quality: it’s straight from Hetch Hetchy Reservoir in the High Sierra mountains of Yosemite National Park.
San Francisco Water - Frequently Asked Questions
By Phone: | 650-652-3102 |
By Email: | adegraca@sfwater.org |
By Mail: | 1657 ROLLINS ROAD BURLINGAME, CA, 94010 |
Existing customers can login to their Sfpuc City Distribution Division account to pay their San Francisco water bill by clicking here.
If you want to pay your Sfpuc City Distribution Division bill online and haven't made an account yet, you can create an account online. Please click here to create your account to pay your San Francisco water bill.
If you don't want to make an account, or can't remember your account, you can make a one-time payment towards your San Francisco water bill without creating an account using a one time payment portal with your account number and credit or debit card. Click here to make a one time payment.
Moving to a new house or apartment in San Francisco means you will often need to put the water in your name with Sfpuc City Distribution Division. In order to put the water in your name, please click the link to the start service form below. Start service requests for water bills typically take two business days.
Leaving your house or apartment in San Francisco means you will likely need to take your name off of the water bill with Sfpuc City Distribution Division. In order to take your name off the water bill, please click the link to the stop service form below. Stop service for water bills requests typically take two business days.
The estimated price of bottled water
$1.74 in USD (1.5-liter)
USER SUBMITTED RATINGS
- Drinking Water Pollution and Inaccessibility
- Water Pollution
- Drinking Water Quality and Accessibility
- Water Quality
The above data is comprised of subjective, user submitted opinions about the water quality and pollution in San Francisco, measured on a scale from 0% (lowest) to 100% (highest).
Related FAQS
San Francisco Water Quality Report (Consumer Confidence Report)
The EPA mandates that towns and cities consistently monitor and test their tap water. They must report their findings in an annual Consumer Confidence Report. Below is the most recent water quality report from San Francisco's Water. If you would like to see the original version of the report, please click here.

2 0 2 0
A N N U A L W A T E R Q U A L I T Y R E P O R T
CITY OF
SAN FRANCISCO

UNDERSTANDING THIS REPORT
The San Francisco Public Utilities Commission (SFPUC) produces this annual report detailing where your water comes from, how we treat it, and its overall chemical composition. We do this not only to meet a regulatory requirement but also provide an educational opportunity for you to understand our drinking water operations and public health protection efforts.
We are committed to providing high quality drinking water for all our customers. Our system is large and we work across several counties to maintain the system that delivers potable water for your consumption. In addition to the wider system outside of San Francisco, we also maintain a system of reservoirs within San Francisco. It is our hope that this report will not only provide you with greater knowledge of your water, but also an increased understanding of the considerable skill, talent, and effort of the SFPUC staff that goes into ensuring businesses and residents have reliable access to this precious resource.
We’re proud of our water, and we hope you are too. Throughout this report, you’ll find facts and figures to help expand upon the basic information we’re required to provide. We hope you enjoy getting to know a little more about who we are as an Agency and how you can get involved.
WATER FACT:
Bottled water not only
contributes to plastic waste
and additional carbon
emissions in transportation,
it is also on average
11 TIMES
more expensive than tap water, and not as heavily regulated as tap water.

OUR DRINKING WATER SOURCES AND TREATMENT
Our drinking water supply consists of surface water and groundwater that are well protected and carefully managed by the SFPUC. These sources are diverse in both the origin and the location with the surface water stored in reservoirs located in the Sierra Nevada, Alameda County and San Mateo County, and groundwater stored in a deep aquifer located in San Francisco and San Mateo counties. Maintaining this variety of sources is an important component of the SFPUC’s near- and
To meet drinking water standards for consumption, water from all of our surface water sources including the upcountry
from state and federal filtration requirements but receives |
|
|
the following treatment: ultraviolet light and chlorine |
WATER FACT: |
|
disinfection, pH adjustment for optimum corrosion |
||
control, fluoridation for dental health protection, and |
of the Earth’s |
|
chloramination for maintaining disinfectant residual |
||
and minimizing the formation of regulated disinfection |
96% water is saline, |
|
byproducts. Water from local Bay Area reservoirs |
||
in Alameda County and San Mateo County is |
is trapped in the |
|
delivered to Sunol Valley Water Treatment Plant |
2% polar caps as ice. |
|
(SVWTP) and Harry Tracy Water Treatment Plant |
||
Humans rely on the remaining |
||
(HTWTP), respectively, and is treated by filtration, |
||
disinfection, fluoridation, optimum corrosion control |
2% for drinking water. |
|
and taste and odor removal processes. |
Source: on.doi.gov/3uNqkjV |
|
In 2020, the SFPUC did not use the UNHHS; a small |
||
|
||
amount of groundwater from two local wells was added |
|
|
to our surface water supplies. |
|
WATERSHED PROTECTION
The SFPUC conducts watershed sanitary surveys for the Hetch Hetchy source annually and for the local water sources and UNHHS every five years. The latest sanitary surveys for the local watersheds and the UNHHS watershed were completed in 2021 for the period of

WATER QUALITY
The SFPUC regularly collects and tests water samples from reservoirs and designated sampling points throughout the system to ensure the water delivered to you meets or exceeds federal and state drinking water standards. In 2020, we conducted more than 95,400 drinking water tests in the source, transmission, and distribution system. This is in addition to the extensive treatment process control monitoring performed by our certified operators and online instruments.
Drinking water, including bottled water, may reasonably be expected to contain at least small amounts of some contaminants. The presence of contaminants does not necessarily indicate that water poses a health risk. In order to ensure that tap water is safe to drink, the United States Environmental Protection Agency (USEPA) and the
FLUORIDATION AND DENTAL FLUOROSIS
Mandated by State law, water fluoridation is a widely accepted practice proven to be safe and effective for preventing and controlling tooth decay. Our fluoride target level in the water is
0.7 milligram per liter (mg/L, or part per million, ppm), which is consistent with the May 2015 State regulatory guidance on optimal fluoride level. Infants fed formula mixed with water containing fluoride at this level may still have a chance of developing tiny white lines or streaks in their teeth. These marks are referred to as mild to very mild fluorosis, and are often only visible under a microscope. Even in cases where the marks are visible, they do not pose any health risk. The Centers of Disease Control (CDC) considers it safe to use optimally fluoridated water for preparing infant formula. To lessen this chance of dental fluorosis, you may choose to use
Contact your healthcare provider or
waterboards.ca.gov/drinking_water/certlic/drinkingwater/
Fluoridation.html, the CDC website cdc.gov/fluoridation, or
our website sfpuc.org/waterquality.
WATER FACT:
Ever wondered how much water it takes to make breakfast?
On average, it takes about 35 gallons to produce a cup
of coffee beans, 193 gallons to produce the wheat for a 1lb
loaf of bread, and 50 gallons of
water to produce 2 eggs.
Source: waterfootprint.org

GET FAMILIAR WITH
OUR WATERSHEDS
The system that delivers our water is made up of many different sources of water. We work hard to protect our water and water quality. Find out about each of our reservoirs, how much they contribute to the system and how you can visit them.
A watershed is a land area that collects and channels rainfall and snowmelt by gravity to creeks, streams, and rivers, and eventually to common outflow points such as reservoirs, bays,
and the ocean.
CALAVERAS RESERVOIR
CHERRY
LAKE
FUN FACT:
The largest of our East Bay reservoirs, Calaveras is located near a seismically active fault. The original dam was built in 1925, and was recently replaced along with several upgrades to improve our ability to better manage the watershed’s biodiversity.
FUN FACT:
This is the only lake in our system where recreational boating is permitted on the water itself, as this is only an emergency supply. Maintained in partnership with the US Forest Service, Cherry Lake is a popular recreation spot for locals and visitors alike.
CRYSTAL |
FUN FACT: |
SPRINGS |
Actually consisting of two reservoirs, Upper and Lower |
Crystal Springs together provide one of the most accessible |
|
RESERVOIR |
watersheds to visit offering the opportunity to walk, hike, |
and even attend docent lead bike tours along nearby trails. |
|
|
|
HETCH |
FUN FACT: |
The name of our largest reservoir is Miwok for “Valley of the |
|
HETCHY |
Two Trees”, which refers to a pair of pines that once stood at |
the head of Hetch Hetchy Valley. Miwok names are still used |
|
RESERVOIR |
throughout the area, including the two waterfalls Tueeulala |
Fall, Wapama Fall, and Kolana Rock. |
LAKE ELEANOR
PILARCITOS RESERVOIR
FUN FACT:
Although the current lake was created by the damming of the Eleanor Creek in 1918, there was a smaller natural lake located at the same site, and bearing the same name. Today, visitors can take advantage of trails primarily used for moderate hikes as well as the campground.
FUN FACT:
Construction of Pilarcitos Dam began in 1862, and was completed in 1866. It was raised in 1867 and 1874. The dam is an earth fill dam with a clay puddle core, and a height of 95 feet from foundation to crest. The reservoir has a capacity of just over 1 billion gallons. It serves as a key water supply for Half Moon Bay.
SAN ANDREAS |
FUN FACT: |
As the name would suggest, the San Andreas fault runs through |
|
RESERVOIR |
the Reservoir, and the dam holding back the reservoir survived |
the 1906 earthquake. The |
|
|
San Andreas and Crystal Springs reservoirs. |
|
|
SAN ANTONIO |
FUN FACT: |
Located near the town of Sunol in Alameda County, This |
|
RESERVOIR |
reservoir was impounded in 1964 by Turner Dam, named |
after former General Manager of Hetch Hetchy, James H. |
|
|
Turner. Like Calaveras, it is closed to the public. |

WATER FACT:
The cost of SF tap water averages at
$0.002
PER GALLON
SPECIAL HEALTH NEEDS
Some people may be more vulnerable to contaminants in drinking water than the general population.
These people should seek advice about drinking water from their healthcare providers. USEPA/CDC guidelines on appropriate means to lessen the risk of infection by Cryptosporidium and other microbial contaminants are available from the USEPA’s Safe Drinking Water Hotline
BORON DETECTION
ABOVE NOTIFICATION
LEVEL IN SOURCE WATER
In 2020, boron was detected at a level of 1.06 ppm in the raw water stored in Pond F3 East, an approved source in Alameda Watershed. This detection is lower than those in the past, and is slightly above the California Notification level (NL). Boron is an element in nature, and is typically released into air and water when soils and rocks naturally weather. Currently there is no drinking water standard for this
PER- AND POLYFLUOROALKYL SUBSTANCES (PFAS)
PFAS is a group of approximately 5,000

CONTAMINANTS
AND REGULATIONS
Generally, the sources of drinking water (both tap water and bottled water) include rivers, lakes, oceans, streams, ponds, reservoirs, springs and wells. As water travels over the surface of the land or through the ground, it dissolves naturally occurring minerals and, in some cases, radioactive material, and can pick up substances resulting from the presence of animals or from human activity. Such substances are called contaminants, and may be present in source water as:
Microbial contaminants, such as viruses and bacteria that may come from sewage treatment plants, septic systems, agricultural livestock operations and wildlife,
Inorganic contaminants, such as salts and metals, that can be naturally occurring or result from urban stormwater runoff, industrial or domestic wastewater discharges, oil and gas production, mining or farming,
Pesticides and herbicides that may come from a variety of sources such as agriculture, urban stormwater runoff and residential uses,
Organic chemical contaminants, including synthetic and volatile organic chemicals, which are
Radioactive contaminants, which can be naturally occurring or be the result of oil and gas production and mining activities.
More information about contaminants and potential health effects can be obtained by calling the USEPA’s Safe Drinking Water Hotline
DRINKING
WATER AND LEAD
Exposure to lead, if present, can cause serious health effects in all age groups, especially for pregnant women and young children. Infants and children who drink water containing lead could have decreases in IQ and attention span and increases in learning and behavior problems. The children of women who are exposed to lead before or during pregnancy can have increased risk of these adverse health effects. Adults can have increased risks of heart disease, high blood pressure, kidney or nervous system problems.
Lead in drinking water is primarily from materials and components associated with service lines and home plumbing. We are responsible for providing high quality drinking water and removing lead pipes, but we cannot control the variety of materials used in plumbing components in your home. You share the responsibility for protecting yourself and your family from the lead in your home plumbing. You can take responsibility by identifying and removing lead materials within your home plumbing and taking steps to reduce your family’s risk. When your water has been sitting for several hours, you can minimize the potential for lead exposure by flushing your pipes for several minutes, such as running your tap, taking a shower, doing laundry or a load of dishes, before using water for drinking and cooking. You can also use a filter certified by an American National Standards Institute accredited certifier to remove lead from drinking water. If you are concerned about lead in your water you may wish to have your water tested, call 311 or access our website at sfpuc.org/lead to apply for lead testing analysis at a minimal fee. Information about lead in drinking water, testing methods, and steps you can take to minimize exposure is available at epa.gov/safewater/lead.
WATER FACT:
Since 2010, the SFPUC has funded the installation of over
170 Drink-Tap Stations,
including 12 installed in
January 2021 in collaboration with neighborhood groups and the City’s COVID Command Center to support COVID recovery efforts.

In addition to our water source protection efforts, we continue the following programs to minimize customer exposure to lead in water:
-
Replacing the remaining 2% of brass meters with
lead-free automated water meters -
Annual monitoring for lead at transmission system’s entry points (monitoring results in 2020 were
non-detect) - Offering in partnership with the San Francisco Department of Public Health free lead test vouchers for clients enrolled in the Women, Infants and Children (WIC) program
-
Offering
low-cost water tests for lead at $25 per tap. To request a test, call 311 or visit our website sfpuc.org/lead for an application form
LEAD USER SERVICE LINE (LUSL)
In 2020, we continued inspecting and characterizing the 10,912 service lines of unknown material and 4,524 service lines suspected of having lead components, as known as LUSLs. These figures were first reported to
LEAD AND
COPPER TAP SAMPLING RESULTS
We conducted our triennial Lead and Copper Rule (LCR) monitoring in 2018, and these tap sampling results are accessible at sfpuc.org/waterquality. LCR monitoring occurs at household taps within residences. The results do not represent lead and copper concentrations throughout the distribution system. The next round of LCR monitoring will be in 2021.
LEAD IN SCHOOLS
We assisted a total of 190 public and private
WATER FACT:
Only 14 countries report high levels of community and user participation for
collaborative management
and decision-making.
Source: : UN Water: SDG6 Water
and Sanitation for All, 2021.

KEY WATER QUALITY TERMS
The following are definitions of key terms referring to standards and goals of water quality noted on the data table.
Public Health Goal (PHG): The level of a contaminant in drinking water below which there is no known or expected risk to health. PHGs are set by the California Environmental Protection Agency.
Maximum Contaminant Level Goal (MCLG): The level of a contaminant in drinking water below which there is no known or expected risk to health. MCLGs are set by the USEPA.
Maximum Contaminant Level (MCL): The highest level of a contaminant that is allowed in drinking water. Primary MCLs are set as close to the PHGs or MCLGs as is economically and technologically feasible. Secondary MCLs (SMCLs) are set to protect the odor, taste, and appearance of drinking water.
Maximum Residual Disinfectant Level (MRDL): The highest level of a disinfectant allowed in drinking water. There is convincing evidence that addition of a disinfectant is necessary for control of microbial contaminants.
Maximum Residual Disinfectant Level Goal (MRDLG): The level of a drinking water disinfectant below which there is no known or expected risk to health. MRDLGs do not reflect the benefits of the use of disinfectants to control microbial contaminants.
Primary Drinking Water Standard (PDWS): MCLs, MRDLs, and TT (see below) for contaminants that affect health along with their monitoring and reporting requirements, and water treatment requirements.
Regulatory Action Level: The concentration of a contaminant which, if exceeded, triggers treatment or other requirements that a water system must follow.
Treatment Technique (TT): A required process intended to reduce the level of a contaminant in drinking water.
Turbidity: A water clarity indicator that measures cloudiness of the water, and is also used to indicate the effectiveness of the filtration system. High turbidity can hinder the effectiveness of disinfectants.
Cryptosporidium is a parasitic microbe found in most surface water. We regularly test for this waterborne pathogen and found it at very low levels in source water and treated water in 2020. However, current test methods approved by the USEPA do not distinguish between dead organisms and those capable of causing disease. Ingestion of Cryptosporidium may produce symptoms of nausea, abdominal cramps, diarrhea, and associated headaches. Cryptosporidium must be ingested to cause disease, and it may be spread through means other than drinking water.
OUR WATER IN THE COMMUNITY: THE WESTSIDE ENHANCED WATER RECYCLING PROJECT
On the west side of San Francisco, we are aiming to save up to 2 million gallons per day (mgd) on average of drinking water that is currently used for
Almost 8 miles of new recycled water pipelines have been constructed mostly under City streets. These pipelines will bring recycled water from the newly constructed treatment facility to sites where the water will be used. Construction has also begun on an underground recycled water reservoir, and

SAN FRANCISCO WATER SYSTEM-WATER QUALITY DATA FOR 2020
The table below lists detected contaminants in our drinking water in 2020 and the information about their typical sources. Contaminants below detection limits for reporting are not shown, in accord with regulatory guidance. We hold a
DETECTED CONTAMINANTS |
UNIT |
MCL |
PHG |
RANGE OR |
AVERAGE |
MAJOR SOURCES IN DRINKING WATER |
|
OR (MCLG) |
LEVEL FOUND |
OR [MAX] |
|||||
|
|
|
|
||||
|
|
|
|
|
|
|
|
TURBIDITY |
|
|
|
|
|
|
|
Unfiltered Hetch Hetchy Water |
NTU |
5 |
N/A |
0.2 - 0.5 (1) |
[1.3] |
Soil runoff |
|
|
NTU |
1 (2) |
N/A |
- |
[0.4] |
Soil runoff |
|
Filtered Water from Sunol Valley |
|
Min 95% of |
|
|
|
|
|
Water Treatment Plant (SVWTP) |
- |
samples |
N/A |
99.8% - 100% |
- |
Soil runoff |
|
|
|
≤0.3 NTU (2) |
|
|
|
|
|
|
NTU |
1 (2) |
N/A |
- |
[0.1] |
Soil runoff |
|
Filtered Water from Harry Tracy |
|
Min 95% of |
|
|
|
|
|
Water Treatment Plant (HTWTP) |
- |
samples |
N/A |
100% |
- |
Soil runoff |
|
|
|
≤0.3 NTU (2) |
|
|
|
|
DISINFECTION
Total Trihalomethanes
Haloacetic Acids
Total Organic Carbon (4)
MICROBIOLOGICAL
Total Coliform
Giardia lamblia
INORGANICS
Fluoride (source water) (5) Chloramine (as chlorine)
ppb ppb ppm
-
cyst/L
ppm ppm
80
60
TT
NoP ≤5.0% of
monthly samples
TT
2.0
MRDL = 4.0
N/A |
13 |
- 43 |
[43] (3) |
|
N/A |
10 |
- 33 |
[35] (3) |
|
N/A |
1.7 |
- 3.4 |
2.9 |
Various natural and |
(0) |
|
- |
[0.6%] |
Naturally present in the environment |
(0) |
0 - |
0.05 |
0.01 |
Naturally present in the environment |
1 |
ND - 0.7 |
0.3 (6) |
Erosion of natural deposits; water additive to promote strong teeth |
|
MRDLG = 4 |
0.1 |
- 3.5 |
[2.5] (7) |
Drinking water disinfectant added for treatment |
CONSTITUENTS WITH SECONDARY STANDARDS
Chloride
Specific Conductance
Sulfate
Total Dissolved Solids
Turbidity
LEAD AND COPPER (8)
Copper
Lead
UNIT
ppm
µS/cm
ppm ppm
NTU
UNIT
ppb ppb
SMCL
500
1600
500
1000
5
AL
1300
15
PHG |
RANGE |
|
N/A |
<3 - 15 |
|
N/A |
30 |
- 260 |
N/A |
1 |
- 34 |
N/A |
<20 - 137 |
|
N/A |
ND - 0.2 |
|
PHG |
RANGE |
300 ND - 103
0.2 <1 - 90
AVERAGE
9
160
17
72
ND
90TH
PERCENTILE
64
6
MAJOR SOURCES OF CONTAMINANT
Runoff / leaching from natural deposits
Substances that form ions when in water
Runoff / leaching from natural deposits
Soil runoff
MAJOR SOURCES IN DRINKING WATER
Internal corrosion of household water plumbing systems Internal corrosion of household water plumbing systems
OTHER WATER QUALITY PARAMETERS
Alkalinity (as CaCO3) Calcium (as Ca) Chlorate (9) Hardness (as CaCO3) Magnesium
pH Potassium Silica Sodium Strontium
UNIT
ppm ppm ppb ppm ppm
-
ppm ppm ppm ppb
ORL
N/A
N/A
800 (NL)
N/A
N/A
N/A
N/A
N/A
N/A
N/A
RANGE
- - 22 67 - 1200
6.7 - 138
- - 79
- - 6.8
- - 9.8
-
- 1.3
2.8 - 7 - - 22 14 - 242
AVERAGE
55
12
262
45
4.0
9.3
0.8
4.8
14
110
KEY
< / ≤ |
= less than / less than or equal to |
|
AL |
= |
Action Level |
Max |
= |
Maximum |
Min |
= |
Minimum |
N/A |
= |
Not Available |
ND |
= |
|
NL |
= |
Notification Level |
NoP |
= Number of |
|
NTU |
= |
Nephelometric Turbidity Unit |
ORL |
= |
Other Regulatory Level |
ppb |
= |
part per billion |
ppm |
= |
part per million |
µS/cm |
= |
microSiemens/centimeter |
FOOTNOTES ON SAN FRANCISCO WATER SYSTEM - WATER QUALITY DATA:
-
These are monthly average turbidity values measured every 4 hours daily. (2) There is no turbidity MCL for filtered water. The limits are based on the TT requirements for filtration systems. (3) This is the highest locational running annual average value. (4) Total organic carbon is a precursor for disinfection byproduct formation. The TT requirement applies to the filtered water from the SVWTP only. (5) The SWRCB
-DDW recommended an optimal fluoride level of 0.7 ppm be maintained in the treated water. In 2020, the range and average of the fluoride levels were 0.6 ppm - 0.9 ppm and 0.7 ppm, respectively. (6) Natural fluoride in the Hetch Hetchy source was ND. Elevated fluoride levels in the raw water at

the SVWTP and HTWTP were attributed to the transfer of fluoridated Hetch Hetchy water into the local reservoirs. (7) This is the highest running annual average value. (8) The most recent Lead and Copper Rule monitoring was in August 2018. Two of the 90 site samples collected
at consumer taps had lead concentrations above the AL. (9) The detected chlorate in the treated water is a degradation product of sodium hypochlorite, which we use for water disinfection.
Note: The different water sources blended at different ratios throughout the year have resulted in varying water quality. Additional water quality data may be obtained by calling our Water Quality Division
San Francisco Local Groundwater - Water Quality Data for Year 2020
Treated Water
(Sunset
Reservoir)
|
|
|
PHG |
RANGE |
|
|
DETECTED CONTAMINANTS |
UNIT |
MCL |
OR |
OR LEVEL |
AVERAGE |
MAJOR SOURCES IN DRINKING WATER |
|
|
|
(MCLG) |
FOUND |
|
|
INORGANICS |
|
|
|
|
|
|
Chromium (VI) |
ppb |
N/A (1) |
0.02 |
ND - 1.3 |
ND |
Leaching from natural deposits; waste discharges |
|
|
|
|
|
|
from electroplating |
Nitrate (as nitrogen) |
ppm |
10 |
10 |
ND - 0.5 |
ND |
Landscape fertilizers and leaked wastewater |
Fluoride |
ppm |
2.0 |
1 |
0.7 |
0.7 |
Erosion of natural deposits; water additive to |
|
|
|
|
|
promote strong teeth |
|
|
|
|
|
RANGE |
|
|
DETECTED CONTAMINANTS |
UNIT |
SMCL |
PHG |
OR LEVEL |
AVERAGE |
MAJOR SOURCES OF CONTAMIANT |
|
|
|
|
FOUND |
|
|
CONSTITUENTS WITH SECONDARY STANDARDS |
|
|
|
|
Chloride
Color
Specific Conductance
Sulfate
Total Dissolved Solids
Turbidity
OTHER WATER QUALITY PARAMETERS
Strontium
ppm Unit µS/cm ppm ppm
NTU
UNIT
ppb
500 N/A
15 N/A
1600 N/A
500 N/A
1000 N/A
5 N/A
ORL
N/A
5.5 - 6.2 5
57 - 325
2.3 - 3.5
25 - 73
0.1
RANGE
22 - 28
5.9 Runoff / leaching from natural deposits
5 |
|
138 |
Substances that form ions when in water |
2.9 Runoff / leaching from natural deposits
50 |
Runoff / leaching from natural deposits |
0.1 Soil runoff
AVERAGE
25
Raw Water
(San Francisco
Local
Groundwater
Wells)
|
|
|
PHG |
|
|
|
|
DETECTED CONTAMINANTS |
UNIT |
MCL |
OR |
RANGE |
AVERAGE |
MAJOR SOURCES IN DRINKING WATER |
|
|
|
|
(MCLG) |
|
|
|
|
INORGANICS (2) |
|
|
|
|
|
|
|
Chromium (VI) |
ppb |
N/A (1) |
0.02 |
2.5 - 23 |
14.7 |
Leaching from natural deposits; waste discharges |
|
|
|
|
|
|
|
from electroplating |
|
Chromium (Total) |
ppb |
50 |
(100) |
ND - 21 |
10.7 |
Erosion of natural deposits; discharge from |
|
|
|
|
|
|
|
electroplating |
|
Nitrate (as nitrogen) |
ppm |
10 |
10 |
3.1 - 9.4 |
5.8 |
Landscape fertilizers and leaked wastewater |
|
VOLATILE ORGANICS |
|
|
|
|
|
|
|
Carbon tetrachloride (3) |
ppb |
0.5 |
0.1 |
0.6 - 0.9 |
0.7 |
Commercial and industrial solvent used in dry |
|
cleaning prior to 1960 |
|||||||
|
|
|
|
|
|
||
Tetrachloroethylene (4) |
ppb |
5 |
0.06 |
1.5 - 2.2 |
1.9 |
Commercial and industrial solvent used in dry |
|
|
|
|
|
|
|
cleaning prior to 2010, and as a metal degreaser in |
|
|
|
|
|
|
|
auto shops and metalworking industries |
|
OTHER WATER QUALITY |
UNIT |
ORL |
|
RANGE |
AVERAGE |
|
|
PARAMETERS |
|
|
|||||
|
|
|
|
|
|
||
pH |
- |
N/A |
|
7.3 - 8.3 |
7.8 |
|
|
Strontium |
ppb |
N/A |
|
131 - 187 |
159 |
|
|
Vanadium |
ppb |
50 (NL) |
|
5.9 - 7 |
6.5 |
|
FOOTNOTES ON SAN FRANCISCO LOCAL GROUNDWATER - WATER QUALITY DATA:
-
Chromium (VI) is currently regulated by the
SWRCB-DDW under a MCL of 50 ppb for total chromium. The results of total chromium monitoring in treated water were ND in 2020. (2) The concentration ranges and averages of these contaminants are indicative of the raw groundwater quality prior to blending, which is approved bySWRCB-DDW as a treatment for groundwater. They are not representative of water in the distribution system. In 2020, only two wells (Lake Merced Well and West Sunset Well) delivered groundwater to the distribution system intermittently. (3) Carbon tetrachloride was detected above the MCL in the raw water at South Sunset Well; however, the well was not in operation throughout 2020. (4) Tetrachloroethylene was slightly detected in the raw water at Golden Gate Central Well, which supplied Golden Gate Park throughout 2020 for irrigation only.

P.O. Box 7369
San Francisco, CA
@MySFPUC
Interested in learning more? Our Commission meets monthly, and more details are on our website
sfpuc.org/commission
Sophie Maxwell, PRESIDENT
Anson Moran, VICE PRESIDENT
Tim Paulson, COMMISSIONER
Ed Harrington, COMMISSIONER
Newsha K. Ajami, COMMISSIONER
This report contains important information about our drinking water. Please contact SFPUC Communications at
Este informe contiene información muy importante sobre su agua para beber. Favor de comunicarse SFPUC a
此份水質報告,內有重要資訊。請找他人為你翻譯和解說清楚。
San Francisco Public Utilities Commission
Every day we deliver
This report contains important information about your drinking water. Translate it, or speak with someone who understands it.
Este informe contiene información muy importante sobre su agua potable. Tradúzcalo o hable con alguien que lo entienda bien.
Mahalaga ang impormasyong ito. Mangyaring ipasalin ito.
Cé rapport contient des information importantes concernant votre eau potable. Veuillez traduire, ou parlez avec quelqu’ un qui peut le comprendre.
Этот отчет содержит важную информацию о вашей питьевой воды. Переведите его или поговорите с тем, кто это понимает.
此份水質報告,內有重要資訊。請找他人為你翻譯和解說清楚。
Dieser Bericht enthält wichtige Information über Ihr Trinkwasser. Bitte übersetzen Sie ihn oder sprechen Sie mit jemandem, der ihn versteht.
Questo rapporto contiene informazioni importanti che riguardano la vostra aqua potabile. Traducetelo, o parlate con una persona qualificata in grado di spiegarvelo.
この報告書には上水道に関する重要な情報が記されております。翻訳を御依頼なされ るか、内容をご理解なさっておられる方にお尋ね下さい。
Contaminants
San Francisco City Water System
EWG's drinking water quality report shows results of tests conducted by the water utility and provided to the Environmental Working Group by the California State Water Resources Control Board, as well as information from the U.S. EPA Enforcement and Compliance History database (ECHO). For the latest quarter assessed by the U.S. EPA (January 2019 - March 2019), tap water provided by this water utility was in compliance with federal health-based drinking water standards.
Utility details
- Serves: 800000
- Data available: 2012-2017
- Data Source: Purchased surface water
- Total: 8
Contaminants That Exceed Guidelines
- Chromium (hexavalent)
- Total trihalomethanes (TTHMs)
Other Detected Contaminants
- Aluminum
- Chlorate
- Fluoride
- Haloacetic acids (HAA5)
- Strontium
- Vanadium
Reminder
Always take extra precautions, the water may be safe to drink when it leaves the sewage treatment plant but it may pick up pollutants during its way to your tap. We advise that you ask locals or hotel staff about the water quality. Also, note that different cities have different water mineral contents.
Sources and Resources
Sources Cited
Additional Resources
Current Weather in San Francisco
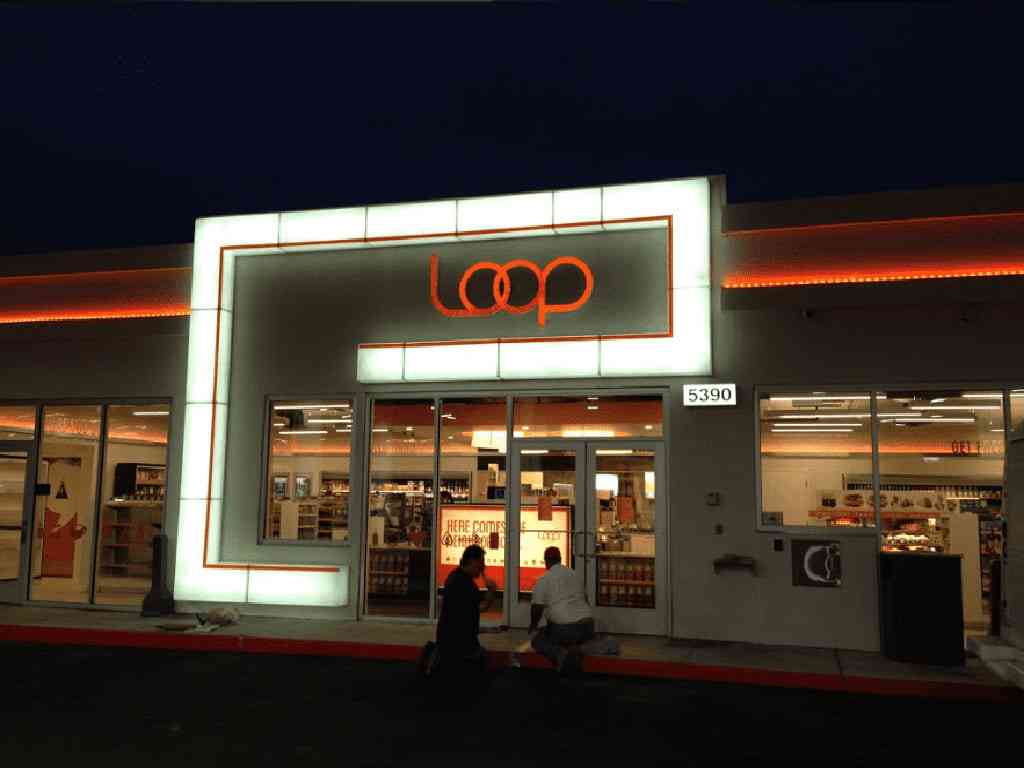
SAN FRANCISCO WEATHERSome of the Local Convenience Stores in San Francisco
- Hill Top General Store
- City Oasis
- 7-Eleven
- Russell's Convenience
- Loop
- Kwik & Convenient
- Dave's Food Store
- Gino's Grocery Co
- Sun Valley Grocery
- Star Convenience
- Potrero Market and Deli
- Hayes Market
- ExtraMile
- Uni-Mart
Estimated Price of Bottled Water
Volume | USD | EUR | GBP |
1.5-liter | $1.87 | â¬1.69 | £1.46 |