Table of Contents
Can You Drink Tap Water in Vista?
Yes, Vista's tap water is generally considered safe to drink as Vista has no active health based violations of the Safe Drinking Water Act (SDWA) that we are aware of. Other factors such as lead piping in a home, or low levels of pollutants on immunocompromised individuals, should also be considered, however. To find more recent info we might have, you can check out our boil water notice page or the city's water provider website.
According the EPA’s ECHO database, from April 30, 2019 to June 30, 2022, Vista's water utility, Vista Irrigation District, had 0 violations of the Safe Drinking Water Act. For more details on the violations, please see our violation history section below. This assessment is based on the Vista Irrigation District water system, other water systems in the city may have different results.
While tap water that meets the EPA health guidelines generally won’t make you sick to your stomach, it can still contain regulated and unregulated contaminants present in trace amounts that could potentially cause health issues over the long-run. These trace contaminants may also impact immunocompromised and vulnerable individuals.
The EPA is reviewing if it’s current regulations around pollutant levels in tap water are strict enough, and the health dangers posed by unregulated pollutants, like PFAS.
Water Quality Report for Vista Tap Water
The most recent publicly available numbers for measured contaminant levels in Vista tap water are in its 2020 Water Quality Report. As you can see, there are levels which the EPA considers to be acceptable, but being below the maximum allowable level doesn’t necessarily mean the water is healthy.
Lead in tap water, for example, is currently allowed at up to 15ppb by the EPA, but it has set the ideal goal for lead at zero. This highlights how meeting EPA standards doesn’t necessarily mean local tap water is healthy.
EPA regulations continue to change as it evaluates the long term impacts of chemicals and updates drinking water acceptable levels. The rules around arsenic, as well as, lead and copper are currently being re-evaluated.
There are also a number of "emerging" contaminants that are not currently. For example, PFAS (Per- and polyfluoroalkyl substances), for which the EPA has issued a health advisory. PFAS are called "forever chemicals" since they tend not to break down in the environment or the human body and can accumulate over time.
We recommend looking at the contaminants present in Vista's water quality reports, or getting your home's tap water tested to see if you should be filtering your water.
Vista Tap Water Safe Drinking Water Act Violation History - Prior 10 Years
Below is a ten year history of violations for the water system named Vista Irrigation District for Vista in California. For more details please see the "What do these Violations Mean?" section below.
Is there Lead in Vista Water?
Based on the EPA’s ECHO Database, 90% of the samples taken from the Vista water system, Vista Irrigation District, between sample start date and sample end date, were at or below, 0.0018 mg/L of lead in Vista water. This is 12.0% of the 0.015 mg/L action level. This means 10% of the samples taken from Vista contained more lead.
While Vista water testing may have found 0.0018 mg/L of lead in its water, that does not mean your water source has the same amount. The amount of lead in water in a city can vary greatly from neighborhood to neighborhood, or even building to building. Many buildings, particularly older ones, have lead pipes or service lines which can be a source of contamination. To find out if your home has lead, we recommend getting you water tested.
No amount of lead in water is healthy, only less dangerous. As lead accumulates in our bodies over time, even exposure to relatively small amounts can have negative health effects. For more information, please check out our Lead FAQ page.
Are there PFAS in Vista Tap Water?
Currently, testing tap water for PFAS isn’t mandated on a national level. We do have a list of military bases where there have been suspected or confirmed leaks. There appears to be at least one military base - Camp Pendleton - near Vista with suspected leaks.
With many potential sources of PFAS in tap water across the US, the best information we currently have about which cities have PFAS in their water is this ewg map, which you can check to see if Vista has been evaluated for yet.
Our stance is better safe than sorry, and that it makes sense to try to purify the tap water just in case.
What do these Violations Mean?
Safe Drinking Water Act Violations categories split into two groups, health based, and non-health based. Generally, health based violations are more serious, though non-health based violations can also be cause for concern.
Health Based Violations
- Maximum contaminant levels (MCLs) - maximum allowed contaminant level was exceeded.
- Maximum residual disinfectant levels (MRDLs) - maximum allowed disinfectant level was exceeded.
- Other violations (Other) - the exact required process to reduce the amounts of contaminants in drinking water was not followed.
Non-Health Based Violations
- Monitoring and reporting violations (MR, MON) - failure to conduct the required regular monitoring of drinking water quality, and/or to submit monitoring results on time.
- Public notice violations (Other) - failure to immediately alert consumers if there is a serious problem with their drinking water that may pose a risk to public health.
- Other violations (Other) - miscellaneous violations, such as failure to issue annual consumer confidence reports or maintain required records.
SDWA Table Key
| Field | Description |
|---|---|
| Compliance Period | Dates of the compliance period. |
| Status |
Current status of the violation.
|
| Health-Based? | Whether the violation is health based. |
| Category Code |
The category of violation that is reported.
|
| Code | A full description of violation codes can be accessed in the SDWA_REF_CODE_VALUES (CSV) table. |
| Contaminant Code | A code value that represents a contaminant for which a public water system has incurred a violation of a primary drinking water regulation. |
| Rule Code |
Code for a National Drinking Water rule.
|
| Rule Group Code |
Code that uniquely identifies a rule group.
|
| Rule Family Code |
Code for rule family.
|
For more clarification please visit the EPA's data dictionary.
Vista Water - Frequently Asked Questions
| By Phone: | 760-597-3162 |
| By Email: | bhodgkiss@vidwater.org |
| By Mail: | 1391 Engineer Street VISTA, CA, 92081 |
Existing customers can login to their Vista Irrigation District account to pay their Vista water bill by clicking here.
If you want to pay your Vista Irrigation District bill online and haven't made an account yet, you can create an account online. Please click here to create your account to pay your Vista water bill.
If you don't want to make an account, or can't remember your account, you can make a one-time payment towards your Vista water bill without creating an account using a one time payment portal with your account number and credit or debit card. Click here to make a one time payment.
Moving to a new house or apartment in Vista means you will often need to put the water in your name with Vista Irrigation District. In order to put the water in your name, please click the link to the start service form below. Start service requests for water bills typically take two business days.
Leaving your house or apartment in Vista means you will likely need to take your name off of the water bill with Vista Irrigation District. In order to take your name off the water bill, please click the link to the stop service form below. Stop service for water bills requests typically take two business days.
The estimated price of bottled water
$2.75 in USD (1.5-liter)
USER SUBMITTED RATINGS
- Drinking Water Pollution and Inaccessibility
- Water Pollution
- Drinking Water Quality and Accessibility
- Water Quality
The above data is comprised of subjective, user submitted opinions about the water quality and pollution in Vista, measured on a scale from 0% (lowest) to 100% (highest).
Related FAQS
Vista Water Quality Report (Consumer Confidence Report)
The EPA mandates that towns and cities consistently monitor and test their tap water. They must report their findings in an annual Consumer Confidence Report. Below is the most recent water quality report from Vista's Water. If you would like to see the original version of the report, please click here.
CONSUMER CONFIDENCE REPORT
Last year, your water met all
Federal and State
Drinking Water Standards.
2021
Vista Irrigation District tests the drinking water quality for many constituents as required by State and Federal regulations.
This report shows the results of our monitoring for the period of January 1, 2020 through December 31, 2020.
WHAT’S THIS REPORT ABOUT?
Vista Irrigation District (District) is pleased to present its annual Consumer Confidence Report (CCR), also known as the Water Quality Report. The District takes all steps necessary to safeguard your water supply, conducting more than 12,000 tests for over 75 drinking water constituents. This report provides a snapshot of the quality of water we provided last year. Included are details about where your water comes from, what it contains and how it compares to state standards. We are committed to providing you with information because informed customers are our best customers.
If you have any questions or concerns regarding the information presented in this report, please contact Dean Farris, Water Distribution Supervisor, at (760)
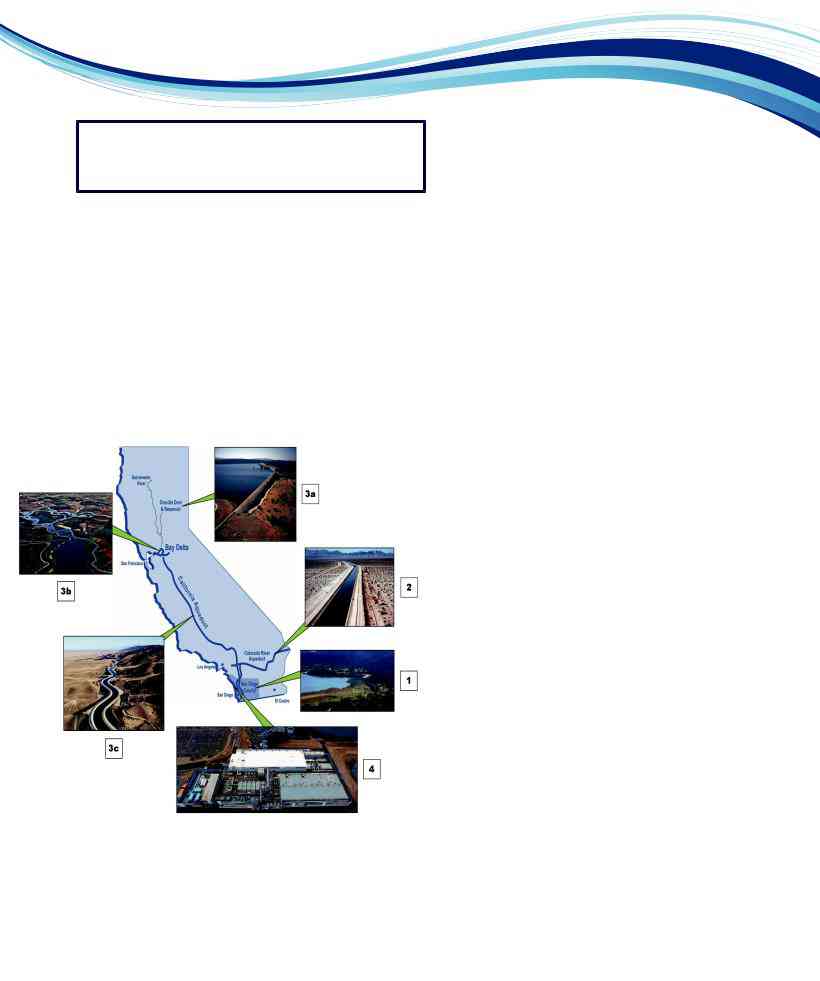
Pictured Left: California Water Infrastructure Map
- Local Water Source - Lake Henshaw;
- Imported Water Source - Colorado River Aqueduct;
- Imported Water Sources: 3a. Oroville Dam & Reservoir, 3b. Bay Delta, 3c. California Aqueduct;
- Desalinated Seawater - Carlsbad Desalination Plant
WHERE DOES MY WATER COME FROM?
Vista Irrigation District (District) uses four sources for your drinking water. The first one is local water, which originates from the watershed and well fields located near Lake Henshaw. The District owns the
Esté informe contiene información muy importante sobre su agua potable. Communiquése con Vista Irrigation
District para obtener una copia de éste reportaje en Español. Llame al (760)
WHAT WERE THE FINDINGS OF THE LOCAL AND IMPORTED
SOURCE WATER ASSESSMENTS?
WHY IS THERE ANYTHING IN MY WATER? Local Water Sources
The sources of drinking water (both tap water and bottled water) include rivers, lakes, streams, ponds, reservoirs, springs, and wells. As water travels over the surface of the land or through the ground, it dissolves
The following contaminants may potentially be present in our water sources:
- Microbial contaminants, such as viruses and bacteria, that may come from sewage treatment plants, septic systems, agricultural livestock operations, and wildlife.
-
Inorganic contaminants, such as salts and metals, that can be
naturally-occurring or result from urban stormwater runoff, industrial or domestic wastewater discharges, oil and gas production, mining, or farming. - Pesticides and herbicides, which may come from a variety of sources such as agriculture, urban stormwater runoff, and residential uses.
-
Organic chemical contaminants, including synthetic and volatile organic chemicals, that are
by-products of industrial processes and petroleum production, and can also come from gas stations, urban stormwater runoff, agricultural application and septic systems. - Radioactive contaminants, which can be naturally- occurring or be the result of oil and gas production and mining activities.
Imported Water Sources
The Metropolitan Water District of Southern California (MWD) completed its source water assessment of its Colorado River and California State Water Project supplies in December 2002. Colorado River supplies are considered to be most vulnerable to contamination from recreation, urban/storm water runoff, increasing urbanization in the watershed and wastewater. State Water Project supplies are considered most vulnerable to contamination from urban/storm water runoff, wildlife, agriculture, recreation and wastewater.
MWD updates its source water assessment through watershed sanitary surveys every five years. The most recent watershed sanitary surveys of its source water supplies from the Colorado River was updated in 2015 and the State Water Project was updated in 2016. Watershed sanitary surveys examine potential sources of contamination, summarize and evaluate water quality data and compliance with regulations, and recommend actions to better protect and improve source water quality.
In April 2016, Vista Irrigation District (District), in conjunction with the City of Escondido, prepared a sanitary survey of the local watershed. This survey assesses activities within the watershed that have the potential to influence the quality of water delivered from Lake Henshaw, Dixon Lake and Lake Wohlford. While the survey identifies a number of activities that have the potential to adversely affect water quality, including residential septic facilities, highway
DO I NEED TO TAKE PRECAUTIONS?
Drinking water, including bottled water, may reasonably be expected to contain at least small amounts of some contaminants. The presence of contaminants does not necessarily indicate that the water poses a health risk. More information about contaminants and potential health effects can be obtained by calling the U.S. Environmental Protection Agency’s (USEPA) Safe Drinking Water Hotline at
Some people may be more vulnerable to contaminants in drinking water than the general population. Immuno- compromised persons, such as persons with cancer undergoing chemotherapy, persons who have undergone organ transplants, people with HIV/AIDS or other immune system disorders, some elderly, and infants can be particularly at risk from infections. These people should seek advice about drinking water from their health care providers. USEPA/Centers for Disease Control (CDC) guidelines on appropriate means to lessen the risk of infection by Cryptosporidium and other microbial contaminants are available by calling the Safe Drinking Water Hotline at
FREQUENTLY ASKED QUESTIONS
- What affects the taste of my water?
A. The taste of drinking water is affected by its mineral content as well as the presence of chlorine, which is used to protect against potential bacterial contamination. Sometimes plumbing can cause a metallic flavor, especially if the water has been sitting in pipes for many hours. Taste, however, does not indicate a higher or lower degree of water quality.
- What causes bad odors?
A. Musty or fishy odors can be caused by harmless algae in the water, especially during the hot summer months. Even after chlorine has been added to disinfect the water, these odors may persist. Also, many people mistakenly confuse odors from their sink drain with the smell of their tap water. Check for tap water odors by filling a glass with fresh tap water and smelling it away from the sink.
- What causes hardness in water?
A. A water’s “hardness” is a measure of the amount of certain minerals that are dissolved in the water. Depending on varying sources and system flows, the hardness of Vista Irrigation District water ranged from 42- 280 mg/L in 2020. These values translate to 2.5 – 16.4 grains per gallon (gpg). These numbers may be of interest because some household appliances (such as dishwashers or water treatment devices) have settings that need to be adjusted based on the hardness of the water.
The minerals in water may leave white spots on glasses, coffeepots, shower heads or shower doors. These spots are chiefly calcium deposits and are not harmful to health. Putting vinegar in a coffeepot and allowing it to sit overnight will usually remove the spots. Make sure to rinse well before using. There are also some store products you can use to avoid spotting when glasses are washed and allowed to dry.
- Why am I required to have a backflow device?
-
When customers’ private pipes intersect with water system pipelines, a
cross-connection is created. Without necessary protections, contamination can result from backflow, or reverse flow, due to changes in water pressure in the distribution system; a backflow device prevents the flow of potentially contaminated water from a customer’s pipelines into the water distribution system. In compliance with state law, Vista Irrigation District requires an approved backflow device on commercial, industrial, agricultural andmulti-family accounts as well as properties with wells. Backflow protection may also be required on accounts considered “high risk”, such as chemical processing, medical and dental facilities, flower growers, and recreational vehicle dump stations.
- What is Geosmin?
-
Geosmin is a
non-harmful, naturally occurring compound produced by bacteria in soil and algae found in surface water. Geosmin is common throughout the United States; in southern California, it is most noticeable during warmer months and when Vista Irrigation District’s water supply is sourced from open surface reservoirs. Geosmin typically produces an earthy or musty odor similar to the odor of damp soil and is detectable by many people at concentrations of 5 to 10 parts per trillion (that’s five to ten drops in 16 Olympic size pools). Chilling water, adding ice cubes, a slice of lemon or cucumber, or a few drops of lemon juice will improve the taste and odor.
- What causes cloudy water?
A. Cloudy or
LEAD AND COPPER
The U.S. Environmental Protection Agency Lead and Copper Rule requires Vista Irrigation District (District) to collect special samples of lead and copper every three years; the last samples were collected in 2018. Lead was not detected at reporting levels in either the source water or private households. Copper was not detected at reporting levels in the source water but was detected in low levels in private households; the source of copper comes from the leaching of copper used in household plumbing fixtures.
If present, elevated levels of lead can cause serious health problems, especially for pregnant women and young children. Lead in drinking water is primarily from materials and components associated with service lines and home plumbing. The District is responsible for providing high quality drinking water, but cannot control the variety of materials used in plumbing components. When your water has been sitting for several hours, you can minimize the potential for lead exposure by flushing your tap for 30 seconds to 2 minutes before using water for drinking or cooking. If you are concerned about lead in your water, you may wish to have your water tested. Information on lead in drinking water, testing methods, and steps you can take to minimize exposure is available from the Safe Drinking Water Hotline or at http://www.epa.gov/lead.
WHAT ARE THESE TABLES?
The data tables shown on this page and the following two pages list all of the drinking water constituents that were detected during the most recent sampling for the constituent. The presence of these constituents in the water does not necessarily indicate that the water poses a health risk. The State Water Resources Control Board (SWRCB) requires Vista Irrigation District to monitor for certain constituents less than once per year because the concentrations are not expected to vary significantly from year to year. Some of the data, though representative of the water quality, are more than one year old. The terms used in these data tables can be found listed at the end of the table.
The following tables show water from three sources - local water from Lake Henshaw, which is treated at the
2020 WATER QUALITY MONITORING RESULTS
Parameter
Units
Federal or State
MCL
[MRDL]
PHG
(MCLG)
[MRDLG]
Range
Average
Treatment Plant Effluents |
|
|
||
|
|
|
|
|
|
Skinner, |
|
|
|
Twin Oaks Valley, |
|
Carlsbad |
DLR |
|
Water Treatment |
& Weese Water |
|
Desalination |
|
Treatment Plants |
|
|
||
Plant |
Combined |
|
Plant |
|
|
Effluents |
|
|
|
|
|
|
|
|
Typical Source/
Comments
Primary Standards
Clarity (Turbidity)
Combined Filter
Effluent Turbidity*
|
|
|
Range |
0.03 - 0.11 |
0.01 - 0.27 |
NR |
|
|
NTU |
TT=1 |
NA |
Average |
0.05 |
0.013 |
NR |
NA |
Soil Runoff |
|
|
|
Highest |
0.11 |
0.27 |
0.08 |
|
|
|
|
|
|
|
|
|
|
|
|
TT=95% |
|
|
|
|
|
NA |
|
% |
of samples |
NA |
Percentage |
100.0% |
100.0% |
100% |
Soil Runoff |
|
|
≤ 0.3% |
|
|
|
|
|
|
|
- Turbidity is a measurement of the cloudiness of water and is a good indicator of water quality and filtration performance. Turbidity results, which meet performance standards, are considered to be in compliance with filtration requirements.
Inorganic Constituents
|
|
|
|
|
Range |
NR |
|
ND - 1.1 |
ND |
2 |
Erosion of natural deposits; |
|
|
Arsenic (As) |
ug/L |
10 |
0.004 |
|
|
|
|
|
glass and electronics |
||
Average |
NR |
|
ND |
ND |
||||||||
|
|
|
|
|
|
|
production waste |
|
||||
|
Chlorite |
mg/L |
1 |
0.05 |
Range |
0.15 - 0.42 |
|
NR |
NR |
0.02 |
||
|
|
|
|
|
|
chlorination |
||||||
|
Average |
0.25 |
|
NR |
NR |
|||||||
|
|
|
|
|
|
|
||||||
|
|
|
|
|
|
|
|
|
||||
|
|
|
|
|
|
|
|
|
|
|
|
|
|
Fluoride |
mg/L |
2 |
1 |
Range |
0.6 - 0.8 |
|
0.2 - 0.9 |
0.61 - 0.80 |
0.1 |
Erosion of natural deposits; |
|
|
|
|
|
|
|
|||||||
|
Treatment Related |
Average |
0.68 |
|
0.7 |
0.7 |
water additive for dental health |
|||||
|
|
|
|
|
|
|||||||
|
|
|
|
|
|
|
|
|
||||
|
|
|
|
|
|
|
|
|
|
|
|
|
|
Nitrate (N) |
mg/L |
10 |
10 |
Range |
NR |
|
ND - 0.4 |
ND |
0.4 |
Runoff/leaching from fertilizer |
|
|
Average |
NR |
|
ND |
ND |
use; sewage; natural erosion |
||||||
|
|
|
|
|
|
|
||||||
|
|
|
|
|
|
|
|
|
||||
|
|
|
|
|
|
|
|
|
|
|
|
|
|
Total Organic Carbon |
mg/L |
TT |
NS |
Range |
1.5 - 3.4 |
|
2.0 - 2.6 |
NR |
0.3 |
Naturally occurring organic |
|
|
|
|
|
|
|
|||||||
|
(TOC) |
Average |
2.0 |
|
2.4 |
NR |
material |
|||||
|
|
|
|
|
|
|||||||
|
|
|
|
|
|
|
|
|
||||
|
Radionuclides Analyzed Every Four Years for Four Consecutive Quarters |
|
|
|
|
|
||||||
|
|
|
|
|
|
|
|
|
|
|
|
|
|
Gross Alpha Activity |
pCi/L |
15 |
0 |
Range |
ND - 3 |
|
ND - 3 |
ND |
3 |
Erosion of natural deposits |
|
|
|
|
|
|
|
|||||||
|
Average |
ND |
|
ND |
ND |
|||||||
|
|
|
|
|
|
|
|
|
||||
|
|
|
|
|
|
|
|
|
|
|
|
|
|
Gross Beta Activity |
pCi/L |
50 |
0 |
Range |
ND - 7 |
|
ND - 5 |
ND |
4 |
Decay of natural and |
|
|
|
|
|
|
|
|||||||
|
Average |
ND |
|
ND |
ND |
|||||||
|
|
|
|
|
|
|
||||||
|
|
|
|
|
|
|
|
|
||||
|
|
|
|
|
|
|
|
|
|
|
|
|
|
Uranium (U) |
pCi/L |
20 |
0.43 |
Range |
1 - 2 |
|
ND - 2 |
ND |
1 |
Erosion of natural deposits |
|
|
|
|
|
|
|
|||||||
|
Average |
1.7 |
|
1.4 |
ND |
|||||||
|
|
|
|
|
|
|
|
|
||||
|
Disinfectants and Disinfection Byproduct in Treatment Plant Effluent |
|
|
|
|
|
||||||
|
Effluent Total |
ug/L |
80 |
NS |
Range |
22 - 47 |
|
13 - 38 |
ND |
NS |
||
|
|
|
|
|
|
|||||||
|
Trihalomethanes |
Average |
35 |
|
23 |
ND |
chlorination |
|||||
|
|
|
|
|
|
|||||||
|
|
|
|
|
|
|
|
|
||||
|
|
|
|
|
|
|
|
|
|
|
|
|
|
Effluent Haloacetic Acids |
ug/L |
60 |
NS |
Range |
11 - 25 |
|
ND - 12 |
ND |
NS |
||
|
|
|
|
|
|
|||||||
|
(HAA5) |
Average |
16 |
|
9 |
ND |
chlorination |
|||||
|
|
|
|
|
|
|||||||
|
|
|
|
|
|
|
|
|
||||
|
|
|
|
|
|
|
|
|
|
|
|
|
|
Effluent Total Chlorine |
|
|
|
Range |
2.5 - 3.5 |
|
2.7 - 3.7 |
2.8 - 3.4 |
|
Addition of chlorine and |
|
|
|
|
|
|
|
|
|
|
|
|||
|
mg/L |
[4] |
[4] |
|
|
|
|
|
- |
ammonia as combined |
||
|
Residual |
|
|
|
|
|
||||||
|
|
|
|
Average |
3.0 |
|
3.3 |
3.2 |
|
disinfectant chloramines. |
||
|
|
|
|
|
|
|
||||||
|
|
|
|
|
|
|
|
|
|
|
|
|
2020 WATER QUALITY MONITORING RESULTS (continued)
Parameter
Units
Federal or State
MCL
[MRDL]
|
|
Treatment Plant Effluents |
|
|
||
|
|
|
|
|
|
|
PHG |
Range |
|
Skinner, |
|
|
|
Twin Oaks Valley, |
|
Carlsbad |
DLR |
|||
(MCLG) |
|
|||||
[MRDLG] |
Average |
Water Treatment |
& Weese Water |
|
Desalination |
|
Treatment Plants |
|
|
||||
|
|
Plant |
Combined |
|
Plant |
|
|
|
|
Effluents |
|
|
|
Typical Source/
Comments
Primary Standards (continued)
Disinfectants and Disinfection Byproduct in VID Distribution System
Total |
|
|
|
Range |
|
8.6 - 58.1 |
|
|
ug/L |
80 |
NS |
|
|
|
NS |
||
Highest |
|
|
||||||
Trihalomethanes (TTHM) |
|
51.4 |
chlorination |
|||||
|
|
|
|
|
||||
|
|
|
|
LRAA |
|
|
|
|
|
|
|
|
|
|
|
|
|
|
|
|
|
|
|
|
|
|
|
|
|
|
Range |
|
6.0 - 30.0 |
|
|
Haloacetic Acids (HAA5) |
ug/L |
60 |
NS |
|
|
|
NS |
|
Highest |
|
|
||||||
|
21 |
chlorination |
||||||
|
|
|
|
|
|
|||
|
|
|
|
LRAA |
|
|
|
|
|
|
|
|
|
|
|
|
|
|
|
|
|
|
|
|
|
|
|
|
|
|
Range |
|
0.21 - 3.64 |
|
Addition of chlorine and |
Total Chlorine Residual |
mg/L |
[4] |
[4] |
|
|
|
- |
ammonia as combined |
Average |
|
2.47 |
||||||
|
|
|
|
|
|
disinfectant chloramines. |
||
|
|
|
|
|
|
|
|
|
Microbiological Constituents in VID Distribution System |
|
|
|
|||||
|
|
|
|
|
|
|
|
|
Total Coliform Bacteria |
|
|
|
Range |
|
0.00% - 0.81% |
|
Naturally present in the |
% |
5 |
(0) |
|
|
|
- |
||
Monthly |
|
|
||||||
(monthly positives) |
|
0.81% |
environment |
|||||
|
|
|
|
|
||||
|
|
|
|
Highest |
|
|
|
|
Fecal Coliform/ |
% |
* |
(0) |
Range |
|
0% |
- |
Naturally present in the |
E.Coli |
Average |
|
0% |
environment |
||||
|
|
|
|
|
||||
|
|
|
|
|
|
|
|
|
*Fecal Coliform/E.Coli MCLs: The occurrence of two consecutive total coliform positive samples, one of which contains fecal coliform/E.Coli, constitutes an acute MCL violation. The MCL was not violated in 2019.
Secondary Standards (Aesthetic Standards)
|
|
|
|
|
Range |
NR |
ND - 200 |
ND |
|
Residue from water treatment |
|
Aluminum (Al) |
ug/L |
200 |
NS |
|
|
|
|
50 |
process; natural deposits; |
||
|
|
|
|
|
Average |
NR |
99 |
ND |
|
erosion |
|
|
|
|
|
|
|
|
|
|
|
|
|
|
|
|
|
|
Range |
ND - 1 |
ND - 3 |
ND |
|
Decaying vegetation or other |
|
Color |
|
units |
15 |
NS |
|
|
|
|
- |
naturally occurring organic |
|
|
|
|
|
|
|||||||
|
|
|
|
|
Average |
1 |
ND |
ND |
|
materials |
|
|
|
|
|
|
|
|
|
|
|
|
|
Chloride (Cl) |
|
mg/L |
500 |
NS |
Range |
78 - 130 |
58 - 92 |
54 - 100 |
- |
Runoff/leaching from natural |
|
|
|
|
|
|
|||||||
|
Average |
98 |
79 |
75 |
deposits; seawater influence |
||||||
|
|
|
|
|
|
||||||
|
|
|
|
|
|
|
|||||
|
|
|
|
|
|
|
|
|
|
|
|
Iron (Fe) |
|
mg/L |
0.3 |
NS |
Range |
NR |
ND |
ND |
0.1 |
Runoff/leaching from natural |
|
|
|
|
|
|
|||||||
|
Average |
NR |
ND |
ND |
deposits; industrial wastes |
||||||
|
|
|
|
|
|
||||||
|
|
|
|
|
|
|
|||||
|
|
|
|
|
|
|
|
|
|
|
|
Sulfate (SO4) |
2- |
mg/L |
500 |
NS |
Range |
80 - 290 |
63 - 237 |
12 - 17 |
0.5 |
Runoff/leaching from natural |
|
|
|
|
|
||||||||
|
Average |
165 |
139 |
14 |
deposits; industrial wastes |
||||||
|
|
|
|
|
|
|
|||||
|
|
|
|
|
|
|
|
|
|
|
|
Specific |
|
umho/ |
1600 |
NS |
Range |
612 - 1042 |
152 - 660 |
292 - 516 |
- |
Substances that form ions in |
|
Conductance |
|
cm |
Average |
787 |
420 |
404 |
water; seawater influence |
||||
|
|
|
|
||||||||
|
|
|
|
|
|
|
|||||
|
|
|
|
|
|
|
|
|
|
|
|
Total Dissolved Solids |
mg/L |
1000 |
NS |
Range |
338 - 663 |
300 - 612 |
140 - 276 |
- |
Runoff/leaching from natural |
||
|
|
|
|
deposits; industrial wastes |
|||||||
Average |
479 |
420 |
205 |
||||||||
|
|
|
|
|
|
||||||
|
|
|
|
|
|
|
|||||
|
|
|
|
|
|
|
|
|
|
||
Additional Analyzed |
|
|
|
|
|
|
|
|
|||
|
|
|
|
|
|
|
|
|
|
|
|
Total Alkalinity |
mg/L |
NS |
NS |
Range |
85 - 120 |
79 - 123 |
46 - 104 |
- |
Erosion of natural deposits; |
||
Average |
104 |
103 |
64 |
leaching |
|||||||
|
|
|
|
|
|
||||||
|
|
|
|
|
|
|
|
|
|
|
|
Bicarbonate (HCO3) |
mg/L |
NS |
NS |
Range |
100 - 140 |
NR |
NR |
- |
Erosion of natural deposits; |
||
Average |
125 |
NR |
NR |
leaching |
|||||||
|
|
|
|
|
|
||||||
|
|
|
|
|
|
|
|
|
|
|
|
|
|
mg/L |
NS |
NS |
Range |
130 - 250 |
120 - 280 |
42 - 78 |
- |
Erosion of natural deposits; |
|
Hardness as CaCO3 |
|
|
|
|
|||||||
Average |
193 |
196 |
57 |
leaching |
|||||||
|
|
|
|
||||||||
|
|
|
|
|
|
|
|||||
|
|
|
|
|
|
|
|
|
|
|
|
Calcium (Ca) |
|
mg/L |
NS |
NS |
Range |
32 - 62 |
27 - 73 |
17 - 32 |
- |
Erosion of natural deposits; |
|
|
|
|
|
|
|||||||
|
Average |
48 |
49 |
23 |
leaching |
||||||
|
|
|
|
|
|
||||||
|
|
|
|
|
|
|
|||||
|
|
|
|
|
|
|
|
|
|
|
|
Magnesium (Mg) |
mg/L |
NS |
NS |
Range |
13 - 23 |
12 - 26 |
0.9 - 1.0 |
- |
Erosion of natural deposits; |
||
|
|
|
|
||||||||
Average |
18 |
19 |
0.93 |
leaching |
|||||||
|
|
|
|
|
|
||||||
|
|
|
|
|
|
|
|||||
|
|
|
|
|
|
|
|
|
|
|
|
Sodium (Na) |
|
mg/L |
NS |
NS |
Range |
63 - 90 |
61 - 98 |
45 - 66 |
- |
Erosion of natural deposits; |
|
|
|
|
|
|
|||||||
|
Average |
77 |
75 |
55 |
leaching |
||||||
|
|
|
|
|
|
||||||
|
|
|
|
|
|
|
|||||
|
|
|
|
|
|
|
|
|
|
|
|
2020 WATER QUALITY MONITORING RESULTS (continued)
|
|
|
|
|
|
|
|
|
|
Treatment Plant Effluents |
|
|
|
|||||
|
|
|
Federal |
|
Range |
|
|
|
|
|
|
|
|
|
|
|
|
|
|
|
|
PHG |
|
|
|
|
|
|
Skinner, |
|
|
|
|
Typical Source/ |
|||
Parameter |
|
Units |
or State |
|
Twin Oaks Valley & |
|
Carlsbad |
DLR |
||||||||||
|
(MCLG) |
|
|
Comments |
||||||||||||||
|
|
|
MCL |
Average |
Water Treatment |
|
Weese Water |
|
Desalination |
|
||||||||
|
|
|
|
|
|
|
Plant |
|
|
|
Treatment Plants |
|
Plant |
|
|
|||
|
|
|
|
|
|
|
|
|
|
|
|
Combined Effluents |
|
|
|
|
||
Additional Analyzed (continued) |
|
|
|
|
|
|
|
|
|
|
|
|
|
|
||||
pH |
|
units |
NA |
NS |
Range |
|
7.93 - 8.06 |
|
|
7.4 - 8.5 |
|
|
8.27 - 8.80 |
- |
Measurement of acidity/ alkalinity |
|||
|
|
|
|
|
|
|
|
|
|
|
|
|
||||||
Average |
|
8.0 |
|
|
|
8.0 |
|
|
8.5 |
|||||||||
|
|
|
|
|
|
|
|
|
|
|
|
|
||||||
|
|
|
|
|
|
|
|
|
|
|
|
|
|
|
|
|
|
|
Potassium (K) |
|
mg/L |
NS |
NS |
Range |
|
3.3 - 4.7 |
|
|
|
3.1 - 4.8 |
|
|
NR |
- |
Erosion of natural deposits; |
||
|
|
|
|
|
|
|
|
|
|
|
|
|
||||||
|
Average |
|
4.0 |
|
|
|
3.9 |
|
|
NR |
leaching |
|||||||
|
|
|
|
|
|
|
|
|
|
|
|
|||||||
|
|
|
|
|
|
|
|
|
|
|
|
|
||||||
|
|
|
|
|
|
|
|
|
|
|
|
|
|
|
|
|
|
|
Chlorate |
|
ug/L |
NL=800 |
NS |
Range |
|
150 - 530 |
|
|
|
34 - 290 |
|
|
NR |
20 |
|||
|
|
|
|
|
|
|
|
|
|
|
|
|
||||||
|
Average |
|
350 |
|
|
|
145 |
|
|
NR |
chlorination |
|||||||
|
|
|
|
|
|
|
|
|
|
|
|
|||||||
|
|
|
|
|
|
|
|
|
|
|
|
|
||||||
|
|
|
|
|
|
|
|
|
|
|
|
|
|
|
|
|
|
|
Silica (SiO2) |
|
mg/L |
NS |
NS |
Range |
|
7.0 - 8.7 |
|
|
|
NR |
|
|
NR |
- |
Erosion of natural deposits; |
||
|
|
|
|
|
|
|
|
|
|
|
|
|
||||||
|
Average |
|
8.0 |
|
|
|
NR |
|
|
NR |
leaching |
|||||||
|
|
|
|
|
|
|
|
|
|
|
|
|||||||
|
|
|
|
|
|
|
|
|
|
|
|
|
||||||
|
|
|
|
|
|
|
|
|
|
|
|
|
|
|
|
|
|
|
Unregulated |
|
|
|
|
|
|
|
|
|
|
|
|
|
|
|
|
|
|
Boron (B) |
|
mg/L |
NL=1 |
NS |
Range |
|
0.11 - 0.13 |
|
|
0.13 |
|
|
0.36 - 0.78 |
0.1 |
Runoff/leaching from natural |
|||
|
|
|
|
|
|
|
|
|
|
|
|
|
||||||
|
Average |
|
0.13 |
|
|
|
0.13 |
|
|
0.55 |
deposits; industrial wastes |
|||||||
|
|
|
|
|
|
|
|
|
|
|
|
|||||||
|
|
|
|
|
|
|
|
|
|
|
|
|
||||||
|
|
|
|
|
|
|
|
|
|
|
|
|
|
|
|
|
||
|
|
|
Action |
PHG |
Distribution |
|
Number of |
|
Number of Sites |
|
Typical Source/ |
|||||||
Parameter |
|
Units |
System |
|
|
|
Exceeding |
DLR |
||||||||||
|
Level |
(MCLG) |
|
|
|
Samples |
|
Comments |
||||||||||
|
|
|
90th Percentile |
|
|
|
Action Level |
|
||||||||||
|
|
|
|
|
|
|
|
|
|
|
|
|
||||||
|
|
|
|
|
|
|
|
|
|
|
|
|
|
|||||
Inorganic Constituents - Copper/Lead in Residential Taps (Sampled in 2018) |
|
|
|
|
|
|||||||||||||
Copper (Cu) |
|
|
|
|
|
|
|
|
|
|
|
|
|
|
|
|
|
Corrosion of household |
|
mg/L |
1.3 |
0.3 |
0.40 |
|
|
|
|
53 |
|
|
|
0 |
0.05 |
plumbing systems; erosion of |
|||
|
|
|
|
|
|
|
|
|
||||||||||
|
|
|
|
|
|
|
|
|
|
|
|
|
|
|
|
|
|
natural deposits |
|
|
|
|
|
|
|
|
|
|
|
|
|
|
|
|
|
|
|
|
|
|
|
|
|
|
|
|
|
|
|
|
|
|
|
|
|
Internal corrosion of household |
Lead (Pb) |
|
ug/L |
15 |
0.2 |
ND |
|
|
|
|
53 |
|
|
|
0 |
5 |
water plumbing systems; discharg- |
||
|
|
|
|
|
|
|
|
es from industrial manufacturers; |
||||||||||
|
|
|
|
|
|
|
|
|
|
|
|
|
|
|
|
|
|
|
|
|
|
|
|
|
|
|
|
|
|
|
|
|
|
|
|
|
erosion of natural deposits |
|
|
|
|
|
|
|
|
|
|
|
|
|
|
|
|
|
|
|
TERMS USED IN THIS REPORT
Detection Limit for Reporting (DLR): A detected contaminant is any contaminant detected at or above its detection level for purposes of reporting.
Locational Running Annual Average (LRAA): The average of sample analytical results for samples taken at a particular monitoring location during the previous four calendar quarters.
Maximum Contaminant Level (MCL): The highest level of a contaminant that is allowed in drinking water. Primary MCLs are set as close to the PHGs (or MCLGs) as is economically and technologically feasible. Secondary MCLs are set to protect the odor, taste and appearance of drinking water.
Maximum Contaminant Level Goal (MCLG): The level of a contaminant in drinking water below which there is no known or expected risk to health. MCLGs, set by the U.S. Environmental Protection Agency (USEPA), are not regulatory standards, not enforceable and are not required to be met by public water systems.
Maximum Residual Disinfectant Level (MRDL): The highest level of a disinfectant allowed in drinking water. There is convincing evidence that addition of a disinfectant is necessary for control of microbial contaminants.
Maximum Residual Disinfectant Level Goal (MRDLG): The level of a drinking water disinfectant below which there is no known or expected risk to health. MRDLGs do not reflect the benefits of the use of disinfectants to control microbial contaminants.
Nephelometric Turbidity Units (NTU): Turbidity is a measure of the cloudiness of the water. It is a good indicator of the effectiveness of the water treatment process and distribution system.
Primary Drinking Water Standards (PDWS): MCLs for contaminants that affect health along with their monitoring and reporting requirements, and water treatment requirements.
Public Health Goal (PHG): The level of a contaminant in drinking water below which there is no known or expected risk to health. PHGs, set by the California Environmental Protection Agency, are not regulatory standards, not enforceable and are not required to be met by public water systems.
Regulatory Action Level (AL) / Notification Level (NL): The concentration of a contaminant which, if exceeded, triggers treatment or other requirements which a water system must follow.
Treatment Technique (TT): A required process intended to reduce the level of a contaminant in drinking water.
mg/L: Milligrams per liter or parts per million (ppm) = 1 drop in 10 gallon aquarium
ug/L: Micrograms per liter or parts per billion (ppb) = 1 drop in residential size pool
pCi/L: Picocuries per liter (a measure of radiation)
umho/cm: Micromho per centimeter; measurement of conductivity
NA: Not Applicable
NC: Not Collected
ND: Not Detectable at testing limit
NR: Not Reported
NS: No Standard
≤: Less than or equal to
KEEPING YOU INFORMED
Trust the Tap!
Now more than ever, ensuring a reliable, safe and high quality water supply is a top priority for water providers. Vista Irrigation District (District) water is always safe and reliable due to numerous robust treatment processes used by both the
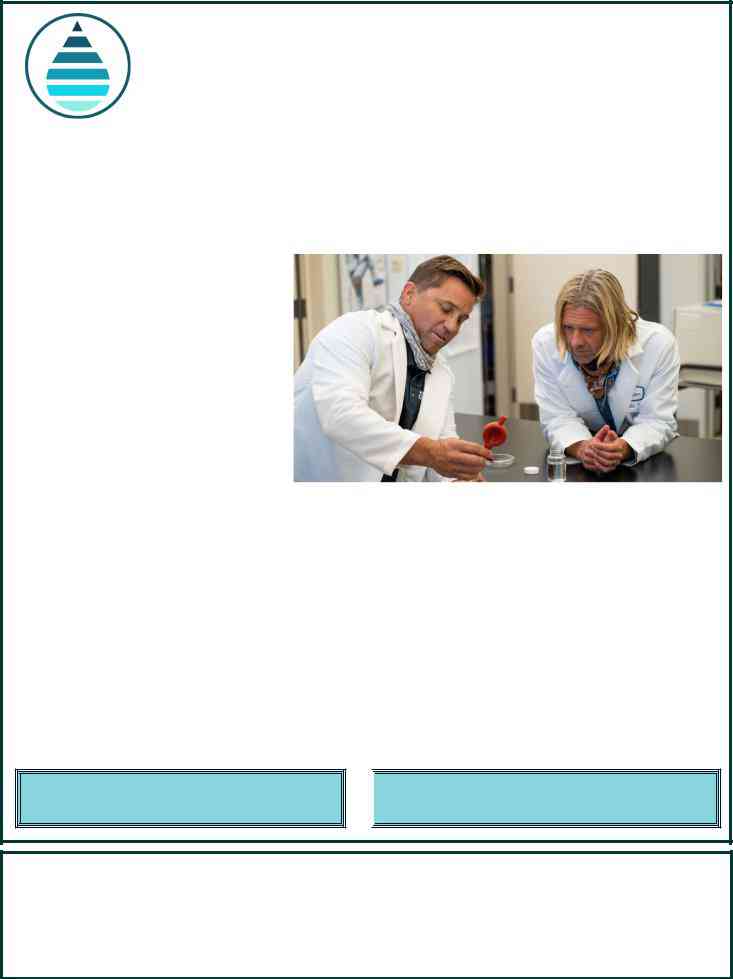
Last year, the District partnered with the Water Authority to promote the quality of local water supplies in the Trust the Tap! video series. The Water Authority and its member agencies, including the District, partnered with Encinitas resident and
Drinking water provided by the District is treated using a combination of technologies, including sedimentation, filtration and disinfection, that chemically deactivate and physically remove bacteria, viruses and other contaminants. To ensure continued water supply safety, the District continuously monitors and tests its water supplies. The District works hard to maintain uninterrupted operation in compliance with state and federal water quality standards.
Maintaining safe and reliable water is our number one priority and the District is proud of ensuring the water that comes out of your tap is safe for our customers. For more information about the safety of your water, visit the websites listed below.
VID HAS NOT HAD ANY VIOLATIONS OF THESE REGULATIONS!
In order to ensure that tap water is safe to drink, the U.S. Environmental Protection Agency (USEPA) and the State Water Resources Control Board (SWRCB) prescribe regulations that limit the amount of certain contaminants in water provided by public water systems. SWRCB regulations also establish limits for contaminants in bottled water that must provide the same protection for public health.
WHERE CAN I GET MORE INFORMATION?
San Diego County Water Authority |
Metropolitan Water District of Southern California |
(858) |
(213) |
www.sdcwa.org |
www.mwdh2o.com |
State Water Resources Control Board |
U.S. Environmental Protection Agency |
Division of Drinking Water Programs |
Office of Ground Water & Drinking Water |
(800) |
|
(619) |
|
Drinking Water Field Operations Branch |
|
www.swrcb.ca.gov/drinking_water/programs/index.shtml |
|
|
|
UPDATE YOUR EMERGENCY CONTACT INFO WITH US
Please take a moment and provide us with a telephone number (or telephone numbers) where you can be reached in case of an emergency. Having updated information allows us to contact you quicker during a situation that affects your water supply. You can update your emergency contact number(s) by emailing or calling Customer Service at (760)
Vista Irrigation District’s board meetings are normally held the first and third Wednesdays of each
month at 9:00 a.m. at the District’s facilities located at 1391 Engineer Street in Vista.
1391 ENGINEER STREET VISTA, CA
-
597-3100 Fax (760)598-8757 www.vidwater.org
District’s office hours: Monday through Friday 8:00 a.m. - 5:00 p.m.
A public agency serving the city of Vista and portions of San Marcos, Escondido, Oceanside and San Diego County
Contaminants
Vista Irrigation District
EWG's drinking water quality report shows results of tests conducted by the water utility and provided to the Environmental Working Group by the California State Water Resources Control Board, as well as information from the U.S. EPA Enforcement and Compliance History database (ECHO). For the latest quarter assessed by the U.S. EPA (January 2019 - March 2019), tap water provided by this water utility was in compliance with federal health-based drinking water standards.
Utility details
- Serves: 124293
- Data available: 2012-2017
- Data Source: Surface water
- Total: 15
Contaminants That Exceed Guidelines
- Bromodichloromethane
- Bromoform
- Chloroform
- Dibromochloromethane
- Dichloroacetic acid
- Total trihalomethanes (TTHMs)
- Trichloroacetic acid
Other Detected Contaminants
- Chlorate
- Chromium (hexavalent)
- Dibromoacetic acid
- Haloacetic acids (HAA5)
- Molybdenum
- Monochloroacetic acid
- Strontium
- Vanadium
Reminder
Always take extra precautions, the water may be safe to drink when it leaves the sewage treatment plant but it may pick up pollutants during its way to your tap. We advise that you ask locals or hotel staff about the water quality. Also, note that different cities have different water mineral contents.
Sources and Resources
Sources Cited
Additional Resources
In recent months, a lot of people have started to wonder if tap water is really that safe to drink. Well, the answer is yes and no. Read on to find out what the dangers are and why you should be concerned.
The first thing you need to know is that a lot of people have no idea what contaminants are even in their drinking wells. They may not believe it but they are drinking water that is full of chemicals that are not supposed to be in it. These include pesticides, herbicides, heavy metals and prescription drugs. This can all be found in your taps!
The second thing that we need to know is that you should be very wary about drinking your drinking water directly from your faucet. This is because your tap water can contain very small traces of drugs, insecticides, lead and bacteria which can be dangerous.
The third thing we should know is that tap water in the United States has also been tainted with drugs since the 1980''s. You should be espec