Table of Contents
Can You Drink Tap Water in San Diego?
Yes, San Diego's tap water is generally considered safe to drink as San Diego has no active health based violations of the Safe Drinking Water Act (SDWA) that we are aware of. Other factors such as lead piping in a home, or low levels of pollutants on immunocompromised individuals, should also be considered, however. To find more recent info we might have, you can check out our boil water notice page, the city's water provider website, or San Diego's local Twitter account.
According the EPA’s ECHO database, from April 30, 2019 to June 30, 2022, San Diego's water utility, City of San Diego, had 5 non-health-based violations of the Safe Drinking Water Act. For more details on the violations, please see our violation history section below. The last violation for San Diego was resolved on April 30, 2020. This assessment is based on the City of San Diego water system, other water systems in the city may have different results.
While tap water that meets the EPA health guidelines generally won’t make you sick to your stomach, it can still contain regulated and unregulated contaminants present in trace amounts that could potentially cause health issues over the long-run. These trace contaminants may also impact immunocompromised and vulnerable individuals.
The EPA is reviewing if it’s current regulations around pollutant levels in tap water are strict enough, and the health dangers posed by unregulated pollutants, like PFAS.
Water Quality Report for San Diego Tap Water
The most recent publicly available numbers for measured contaminant levels in San Diego tap water are in its 2020 Water Quality Report. As you can see, there are levels which the EPA considers to be acceptable, but being below the maximum allowable level doesn’t necessarily mean the water is healthy.
Lead in tap water, for example, is currently allowed at up to 15ppb by the EPA, but it has set the ideal goal for lead at zero. This highlights how meeting EPA standards doesn’t necessarily mean local tap water is healthy.
EPA regulations continue to change as it evaluates the long term impacts of chemicals and updates drinking water acceptable levels. The rules around arsenic, as well as, lead and copper are currently being re-evaluated.
There are also a number of "emerging" contaminants that are not currently. For example, PFAS (Per- and polyfluoroalkyl substances), for which the EPA has issued a health advisory. PFAS are called "forever chemicals" since they tend not to break down in the environment or the human body and can accumulate over time.
We recommend looking at the contaminants present in San Diego's water quality reports, or getting your home's tap water tested to see if you should be filtering your water.
San Diego Tap Water Safe Drinking Water Act Violation History - Prior 10 Years
Below is a ten year history of violations for the water system named City of San Diego for San Diego in California. For more details please see the "What do these Violations Mean?" section below.
From April 1, 2020 to April 30, 2020, San Diego had 1 non-health based Safe Drinking Water Act violation with the violation category being Monitoring Violation, more specifically, the violation code was Monitoring, Routine (RTCR) which falls into the Microbials rule code group, and the Total Coliform Rules rule code family for the following contaminant code: Revised Total Coliform Rule.
From March 1, 2020 to March 31, 2020, San Diego had 1 non-health based Safe Drinking Water Act violation with the violation category being Monitoring Violation, more specifically, the violation code was Monitoring, Routine (RTCR) which falls into the Microbials rule code group, and the Total Coliform Rules rule code family for the following contaminant code: Revised Total Coliform Rule.
From Feb. 1, 2020 to Feb. 29, 2020, San Diego had 1 non-health based Safe Drinking Water Act violation with the violation category being Monitoring Violation, more specifically, the violation code was Monitoring, Routine (RTCR) which falls into the Microbials rule code group, and the Total Coliform Rules rule code family for the following contaminant code: Revised Total Coliform Rule.
From Jan. 1, 2020 to Jan. 31, 2020, San Diego had 1 non-health based Safe Drinking Water Act violation with the violation category being Monitoring Violation, more specifically, the violation code was Monitoring, Routine (RTCR) which falls into the Microbials rule code group, and the Total Coliform Rules rule code family for the following contaminant code: Revised Total Coliform Rule.
From Dec. 1, 2019 to Dec. 31, 2019, San Diego had 1 non-health based Safe Drinking Water Act violation with the violation category being Monitoring Violation, more specifically, the violation code was Monitoring, Routine (RTCR) which falls into the Microbials rule code group, and the Total Coliform Rules rule code family for the following contaminant code: Revised Total Coliform Rule.
From Jan. 1, 2017 to Dec. 31, 2017, San Diego had 2 non-health based Safe Drinking Water Act violations with the violation category being Monitoring and Reporting, more specifically, the violation code was Monitoring, Regular which falls into the Chemicals rule code group, and the Inorganic Chemicals rule code family for the following contaminant codes: Nitrate, Nitrate.
From Jan. 1, 2014 to Dec. 31, 2014, San Diego had 1 non-health based Safe Drinking Water Act violation with the violation category being Monitoring and Reporting, more specifically, the violation code was Monitoring, Regular which falls into the Chemicals rule code group, and the Inorganic Chemicals rule code family for the following contaminant code: Nitrate.
From Jan. 1, 2014 to Dec. 31, 2016, San Diego had 1 non-health based Safe Drinking Water Act violation with the violation category being Monitoring and Reporting, more specifically, the violation code was Monitoring, Regular which falls into the Chemicals rule code group, and the Inorganic Chemicals rule code family for the following contaminant code: Nitrite.
From Jan. 1, 2013 to Dec. 31, 2013, San Diego had 1 non-health based Safe Drinking Water Act violation with the violation category being Monitoring and Reporting, more specifically, the violation code was Monitoring, Regular which falls into the Chemicals rule code group, and the Inorganic Chemicals rule code family for the following contaminant code: Nitrate.
Is there Lead in San Diego Water?
Based on the EPA’s ECHO Database, 90% of the samples taken from the San Diego water system, City of San Diego, between sample start date and sample end date, were at or below, 0.0 mg/L of lead in San Diego water. This is 0% of the 0.015 mg/L action level. This means 10% of the samples taken from San Diego contained more lead.
While San Diego water testing may have found 0.0 mg/L of lead in its water, that does not mean your water source has the same amount. The amount of lead in water in a city can vary greatly from neighborhood to neighborhood, or even building to building. Many buildings, particularly older ones, have lead pipes or service lines which can be a source of contamination. To find out if your home has lead, we recommend getting you water tested.
No amount of lead in water is healthy, only less dangerous. As lead accumulates in our bodies over time, even exposure to relatively small amounts can have negative health effects. For more information, please check out our Lead FAQ page.
Are there PFAS in San Diego Tap Water?
Currently, testing tap water for PFAS isn’t mandated on a national level. We do have a list of military bases where there have been suspected or confirmed leaks. There appears to be at least one military base - NAVBASE CORONADO - near San Diego with suspected leaks.
With many potential sources of PFAS in tap water across the US, the best information we currently have about which cities have PFAS in their water is this ewg map, which you can check to see if San Diego has been evaluated for yet.
Our stance is better safe than sorry, and that it makes sense to try to purify the tap water just in case.
San Diego SDWA Violation History Table - Prior 10 Years
| Compliance Period | Status | Health-Based? | Category Code | Code | Rule Code | Contaminant Code | Rule Group Code | Rule Family Code |
|---|---|---|---|---|---|---|---|---|
| 04/01/2020 - 04/30/2020 | Resolved | No | Monitoring Violation (MON) | Monitoring, Routine (RTCR) (3A) | Revised Total Coliform Rule (111) | Revised Total Coliform Rule (8000) | Microbials (100) | Total Coliform Rules (110) |
| 03/01/2020 - 03/31/2020 | Resolved | No | Monitoring Violation (MON) | Monitoring, Routine (RTCR) (3A) | Revised Total Coliform Rule (111) | Revised Total Coliform Rule (8000) | Microbials (100) | Total Coliform Rules (110) |
| 02/01/2020 - 02/29/2020 | Resolved | No | Monitoring Violation (MON) | Monitoring, Routine (RTCR) (3A) | Revised Total Coliform Rule (111) | Revised Total Coliform Rule (8000) | Microbials (100) | Total Coliform Rules (110) |
| 01/01/2020 - 01/31/2020 | Resolved | No | Monitoring Violation (MON) | Monitoring, Routine (RTCR) (3A) | Revised Total Coliform Rule (111) | Revised Total Coliform Rule (8000) | Microbials (100) | Total Coliform Rules (110) |
| 12/01/2019 - 12/31/2019 | Resolved | No | Monitoring Violation (MON) | Monitoring, Routine (RTCR) (3A) | Revised Total Coliform Rule (111) | Revised Total Coliform Rule (8000) | Microbials (100) | Total Coliform Rules (110) |
| 01/01/2017 - 12/31/2017 | Resolved | No | Monitoring and Reporting (MR) | Monitoring, Regular (03) | Nitrates (331) | Nitrate (1040) | Chemicals (300) | Inorganic Chemicals (330) |
| 01/01/2017 - 12/31/2017 | Resolved | No | Monitoring and Reporting (MR) | Monitoring, Regular (03) | Nitrates (331) | Nitrate (1040) | Chemicals (300) | Inorganic Chemicals (330) |
| 01/01/2014 - 12/31/2014 | Resolved | No | Monitoring and Reporting (MR) | Monitoring, Regular (03) | Nitrates (331) | Nitrate (1040) | Chemicals (300) | Inorganic Chemicals (330) |
| 01/01/2014 - 12/31/2016 | Resolved | No | Monitoring and Reporting (MR) | Monitoring, Regular (03) | Nitrates (331) | Nitrite (1041) | Chemicals (300) | Inorganic Chemicals (330) |
| 01/01/2013 - 12/31/2013 | Resolved | No | Monitoring and Reporting (MR) | Monitoring, Regular (03) | Nitrates (331) | Nitrate (1040) | Chemicals (300) | Inorganic Chemicals (330) |
What do these Violations Mean?
Safe Drinking Water Act Violations categories split into two groups, health based, and non-health based. Generally, health based violations are more serious, though non-health based violations can also be cause for concern.
Health Based Violations
- Maximum contaminant levels (MCLs) - maximum allowed contaminant level was exceeded.
- Maximum residual disinfectant levels (MRDLs) - maximum allowed disinfectant level was exceeded.
- Other violations (Other) - the exact required process to reduce the amounts of contaminants in drinking water was not followed.
Non-Health Based Violations
- Monitoring and reporting violations (MR, MON) - failure to conduct the required regular monitoring of drinking water quality, and/or to submit monitoring results on time.
- Public notice violations (Other) - failure to immediately alert consumers if there is a serious problem with their drinking water that may pose a risk to public health.
- Other violations (Other) - miscellaneous violations, such as failure to issue annual consumer confidence reports or maintain required records.
SDWA Table Key
| Field | Description |
|---|---|
| Compliance Period | Dates of the compliance period. |
| Status |
Current status of the violation.
|
| Health-Based? | Whether the violation is health based. |
| Category Code |
The category of violation that is reported.
|
| Code | A full description of violation codes can be accessed in the SDWA_REF_CODE_VALUES (CSV) table. |
| Contaminant Code | A code value that represents a contaminant for which a public water system has incurred a violation of a primary drinking water regulation. |
| Rule Code |
Code for a National Drinking Water rule.
|
| Rule Group Code |
Code that uniquely identifies a rule group.
|
| Rule Family Code |
Code for rule family.
|
For more clarification please visit the EPA's data dictionary.
San Diego Water - Frequently Asked Questions
| By Phone: | 858-292-6436 |
| By Email: | jguerreiro@sandiego.gov |
| By Mail: | 2797 Caminito Chollas SAN DIEGO, CA, 92105 |
Existing customers can login to their City of San Diego account to pay their San Diego water bill by clicking here.
If you want to pay your City of San Diego bill online and haven't made an account yet, you can create an account online. Please click here to create your account to pay your San Diego water bill.
If you don't want to make an account, or can't remember your account, you can make a one-time payment towards your San Diego water bill without creating an account using a one time payment portal with your account number and credit or debit card. Click here to make a one time payment.
Moving to a new house or apartment in San Diego means you will often need to put the water in your name with City of San Diego. In order to put the water in your name, please click the link to the start service form below. Start service requests for water bills typically take two business days.
Leaving your house or apartment in San Diego means you will likely need to take your name off of the water bill with City of San Diego. In order to take your name off the water bill, please click the link to the stop service form below. Stop service for water bills requests typically take two business days.
The estimated price of bottled water
$1.69 in USD (1.5-liter)
USER SUBMITTED RATINGS
- Drinking Water Pollution and Inaccessibility
- Water Pollution
- Drinking Water Quality and Accessibility
- Water Quality
The above data is comprised of subjective, user submitted opinions about the water quality and pollution in San Diego, measured on a scale from 0% (lowest) to 100% (highest).
Related FAQS
San Diego Water Quality Report (Consumer Confidence Report)
The EPA mandates that towns and cities consistently monitor and test their tap water. They must report their findings in an annual Consumer Confidence Report. Below is the most recent water quality report from San Diego's Water. If you would like to see the original version of the report, please click here.

2020
Annual Drinking Water Quality Report
2 Annual Drinking Water Quality Report 2020
City of San Diego’s Tap Water Supply Meets All State
and Federal Health Standards in 2020
The City of San Diego is committed to providing you with a clean, safe and stable water supply. It’s the priority of every employee of the City’s Public Utilities Department. Those efforts matter. Based on the water quality monitoring data collected in 2020, the City’s tap water met all state and federal drinking water health standards, which are the primary standards for treating and monitoring water. The U.S. Environmental Protection Agency (EPA) and the California Division of Drinking Water mandate all water agencies to produce an annual document educating customers about their drinking water quality for the previous year. This annual Drinking Water Quality Report details the origin of the City’s water supply, what it contains and how it meets health standards.
A Message from the Director
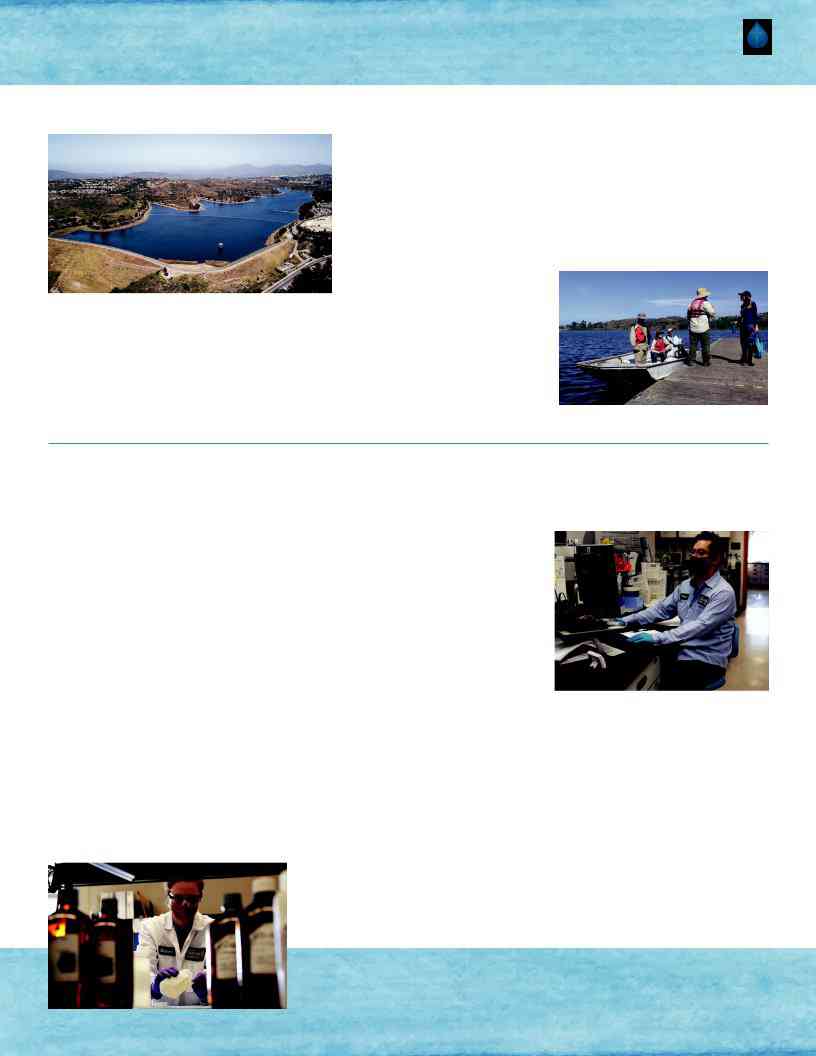
Last year we celebrated the 60th anniversary of the City’s Miramar Reservoir. It was an opportunity to reflect on our past, focus on our current operations and look forward to upcoming projects.
Not only is Miramar Reservoir an important part of our water supply system, but it has become a very popular recreational area for the public. And in the future, Miramar Reservoir will be a key part of the City’s Pure Water system that will provide more than 40% of our drinking water by 2035.
Two major steps forward that were taken in 2020 to begin construction on the Pure Water system included:
- Construction bids were advertised for the North City Pure Water Facility, Morena Northern Alignment and Tunnels, Morena Pump Station and expansions of the North City Water Reclamation Plant and North City Pure Water Pipeline, and
- A U.S. EPA loan was refinanced that will save taxpayers $293 million.
2020 was a difficult year for all of us, and 2021 has its challenges as well. But we are proud that we have been able to continue providing great water and wastewater service to the citizens of San Diego during this pandemic. We adapted in numerous ways by having many employees working from home, instituting new safety protocols at our facilities and in the field and providing more assistance to customers online.
In the coming years you’ll see progress as we build the Pure Water system, continue to upgrade our infrastructure, adapt to better assist the public and improve our water supply to make San Diego a more sustainable city.
Sincerely,
Shauna Lorance
Director of Public Utilities
City of San Diego
CONTACT
Public Utilities Emergency Hotline |
|||
General and Billing Information |
|||
|
|
|
|
Water Quality Lab |
|||
|
|
|
|
Capital Improvements Projects |
|||
City Reservoirs Recreation |
|||
Pure Water Program |
|||
Storm Water Pollution Prevention |
|||
Water Waste/Recycled Water |
|||
|
|
VISIT |
|
|
|
....................... |
|
|
|
|
|
City of San Diego Public Utilities |
|||
San Diego County Water Authority |
|||
Metropolitan Water District |
|||
California Division of Drinking Water |
|||
U.S. EPA |
|||
American Water Works Association |
|||
Be Water Wise |
|||
Pure Water Program |
|||
Think Blue |
|||
ENGAGE
Get It Done App
Annual Drinking Water Quality Report 2020 3
Water Supply - What’s in Your Water
Before It’s Treated?
The sources of drinking water (both tap water and bottled water) include rivers, lakes, streams, ponds, reservoirs, springs and wells. As water travels over the surface of the land or through the ground, it dissolves naturally occurring minerals and, in some cases, radioactive material and can pick up substances resulting from the presence of animals or from human activity. Contaminants that may be present in source water include:
- Microbial contaminants, such as viruses and bacteria that may come from sewage treatment plants, septic systems, agricultural livestock operations and wildlife.
- Inorganic contaminants, such as salts and metals, that can be naturally occurring or result from urban storm water runoff, industrial or domestic wastewater discharges, oil and gas production, mining or farming.
- Pesticides and herbicides that may come from a variety of sources such as agriculture, urban storm water runoff and residential uses.
- Organic chemical contaminants, including synthetic and volatile organic chemicals that are byproducts of industrial processes and petroleum production and can also come from gas stations, urban storm water runoff, agricultural application and septic systems.
- Radioactive contaminants, that can be naturally occurring or be the result of oil and gas production and mining activities.
In order to ensure that tap water is safe to drink, the U.S. Environmental Protection Agency (EPA) and the State Water Resources Control Board (State Board) prescribe regulations that limit the amount of certain contaminants in water provided by public water systems. The U.S. Food and Drug Administration regulations and California law also establish limits for contaminants in bottled water that provide the same protection for public health. Drinking water, including bottled water, may reasonably be expected to contain at least small amounts of some contaminants. The presence of contaminants does not necessarily indicate that water poses a health risk.
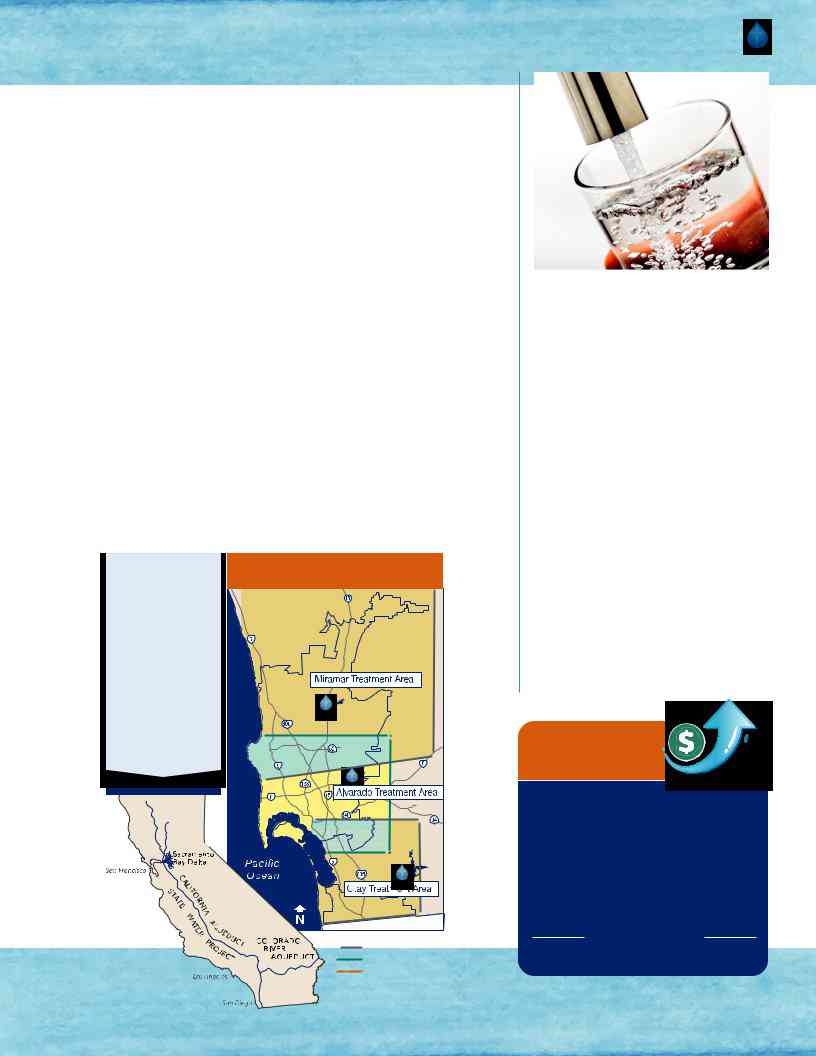
Your water is treated at one of |
Treatment Plant Service Areas |
three municipal water treatment |
|
plants – Alvarado, Miramar and |
|
Otay*.Inordertoprovideareliable |
|
supply of |
|
water,theCity’sdistributionsystem |
|
is interconnected, and the areas |
|
served by each treatment plant |
|
overlap. If your residence falls in |
|
one of the two sections of this map |
|
where service areas overlap, your |
|
water could come from either of |
|
the treatment plants. To gather |
|
information about the water |
|
quality at your residence, you may |
|
need to refer to multiple columns |
|
in the data tables contained in |
|
this report. |
|
Imported Water Sources |
|
*A small portion is treated water |
Miramar Treatment Plant |
|
supplied by Metropolitan Water |
||
Alvarado Treatment Plant |
||
District’s Skinner Water Treatment |
||
Plant and the San Diego County |
Otay Treatment Plant |
|
Water Authority’s Twin Oaks and |
|
|
Carlsbad Desalination water |
|
|
treatment plants. |
|
Imported Water Supply and the Impact on Water Quality
The City of San Diego currently imports most of its water supply, the bulk of which is raw (untreated) water purchased from the San Diego County Water Authority. All raw water is treated before entering the City’s drinking water distribution system. Less than 10% of the imported water purchased from the County Water Authority is a blend of treated water from the Metropolitan Water District’s Skinner Water Treatment Plant, the County Water Authority’s Twin Oaks Valley Water Treatment Plant and the Carlsbad Desalination Plant.
Most of the imported water from the County Water Authority is a blend from the Colorado River and State Water Project (see map to the left). Throughout the year, the ratio of water from each source changes. The constituents that make up the City’s source water are influenced by the water source, climate, geology and the land activities that they flow through. The City continually monitors our source water and adjusts its treatment process to ensure that the water is always healthy and safe.
News on Rate
Increases
You will soon receive information in the mail with details about proposed rate increases for water and wastewater services.
For the first time in 10 years, the City of San Diego is planning to increase wastewater rates, by 5%, starting in January 2022. In addition, the City is proposing to pass through regional water cost increases to its customers.
For more information, visit
4 Annual Drinking Water Quality Report 2020
HIGHLIGHTSOF2020
The City’s Public Utilities Department achieved a number of important milestones last year that included increasing efficiency, improving services and planning for the future.
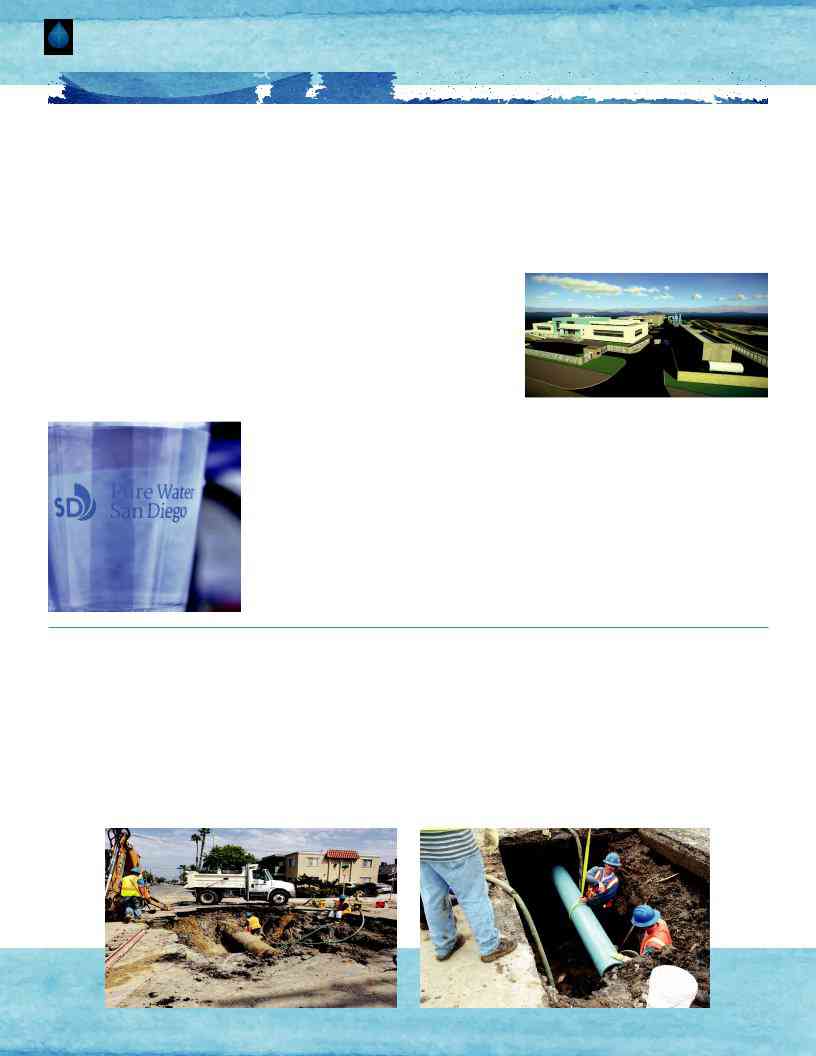
City Takes Major Strides Forward with Pure Water Program
Important milestones were achieved in 2020 for the advancement of the City’s Pure Water Program. Pure Water is the City’s phased,
provide more than 40% of San Diego’s water supply locally by the end of 2035. The Pure Water Program will use proven water purification technology to clean recycled water to produce safe,
water supply. Below are some of the major highlights from 2020:
- Starting in August, the City began seeking construction bids for the North City Pure Water Facility as the first of several bids for the Pure Water Program, which is expected to deliver more than 400 new jobs aiding in the regional economic recovery effort.
-
The City refinanced a loan with the U.S. EPA in September that will save an estimated $293 million for taxpayers. The Water Infrastructure Finance and Innovation Act (WIFIA) loan from the EPA is providing funding for up to $614 million of the costs of the Pure Water Program’s Phase I projects.
Up to about 97% of the Pure Water project costs are expected to be funded with WIFIA loan, State Revolving Fund loans and grant proceeds.
-
The Ocean Pollution Reduction Act II (OPRA II), passed the House of Representatives in November 2020 by an overwhelming vote of
395-4, but the Senate did not take action on the bill before the end of thetwo-year legislative session. Congressman Scott Petersre-introduced the bipartisan legislation this Congress in January 2021, and the House Transportation & Infrastructure Committee approved it on March 24. OPRA II will be considered by the full House and then will move to the Senate for consideration. Under OPRA II, the City of San Diego must demonstrate that its Pure Water Program can produce 83 million gallons a day of water by 2036. With associated water recycling and conservation efforts, this would reduce treated wastewater flows to the ocean from the Point Loma Wastewater Treatment Plant by over 50%. This reduction in outflow and waste will be continuously monitored and subject to ongoing research efforts by academic, city, state and national entities. This bill ensures that San Diego haslong-term certainty for its water supply.
More important steps for the Pure Water Program are anticipated for 2021. More information about the program is available from the City at www.purewatersd.org.
Number of Water Main Breaks Down for Fourth Year in a Row in City of San Diego
For the fourth year in a row, the number of water main breaks decreased in the City of San Diego. There were 33 water main breaks reported in 2020, the lowest
total in more than 15 years and far fewer than the peak of 131 breaks in 2010. The City credits the continued downward trend to increased maintenance efforts and
a
The City’s continuing program to replace old cast iron water mains has played a major part in the decrease in breaks. Some cast iron pipes had been in service for more than 100 years. Since 2013, the City has replaced approximately 180 miles of water pipelines across the city. The remaining 55 miles of cast iron water mains are scheduled to be replaced by 2025. The City now uses water mains made of durable polyvinyl chloride (PVC).
Annual Drinking Water Quality Report 2020 5
City of San Diego Marks Major Milestone with Miramar Reservoir’s 60th Anniversary and Vital Role for Region’s Future
In 2020, the City commemorated the 60th anniversary of Miramar Reservoir while planning for the facility’s important role in the City’s future water needs. For the past six decades, Miramar Reservoir has served millions of San Diegans as part of the City’s water system and as a popular recreational area. Now the City plans to use the reservoir as part of its Pure Water Program system.
Miramar was the last of the City’s nine reservoirs to be created. Its construction was completed in 1960 as part of the second San Diego Aqueduct. Imported water is pumped from the aqueduct to the reservoir before it is treated by the adjacent Miramar Water Treatment Plant and delivered to customers.
When the Pure Water Program comes online, Miramar Reservoir will switch from holding imported water to holding purified water that is received through a pipeline from the planned North City Pure Water Facility. The water will then go through a second treatment process at the Miramar Water Treatment Plant before being distributed to homes and businesses.
Since the
Miramar each year to enjoy jogging, biking, fishing, boating, picnicking and other activities. More information about
Miramar and other City reservoirs is available at
City of San Diego Participated in Statewide Program to Monitor Wastewater for Virus That Causes COVID-19
The City of San Diego participated in a statewide program to monitor its untreated wastewater for severe acute respiratory syndrome coronavirus 2
The California Department of Public Health and the State Water Resources Control Board initiated the Wastewater- based Epidemiology Program in coordination with the Centers for Disease Control and Prevention and are participating in the National Wastewater Surveillance System (NWSS), a collaborative effort among states to monitor wastewater. The NWSS will then inform the incidence, spread and control or epidemiology of
health decision making. The City’s Public Utilities Department was one of five large agencies in California that was already voluntarily participating in a State Water Resources Control Board sponsored research project with the Water Research Foundation titled “Measure Pathogens in Wastewater”
The City’s participation in
In addition, the City participated in multiple studies of its wastewater related to
The City’s collection, treatment and disposal of wastewater are carefully monitored and meet all regulations ensuring the health and safety of our employees, community members and the environment.
While
For more information about City efforts regarding
6 Annual Drinking Water Quality Report 2020
How Do We Make Water Drinkable?
WATER TREATMENT
The City’s Public Utilities Department provides
facilities and
water quality improvements. Using several treatment processes provides multiple barriers for added levels of safety. Our treatment plants employ a combination of
disinfection strategies. Both Alvarado and Miramar water treatment plants use ozone for primary disinfection, while the Otay Water
Treatment Plant uses chlorine dioxide. Conventional water treatment consists of coagulation, flocculation, sedimentation and sand/ multimedia filtration. This
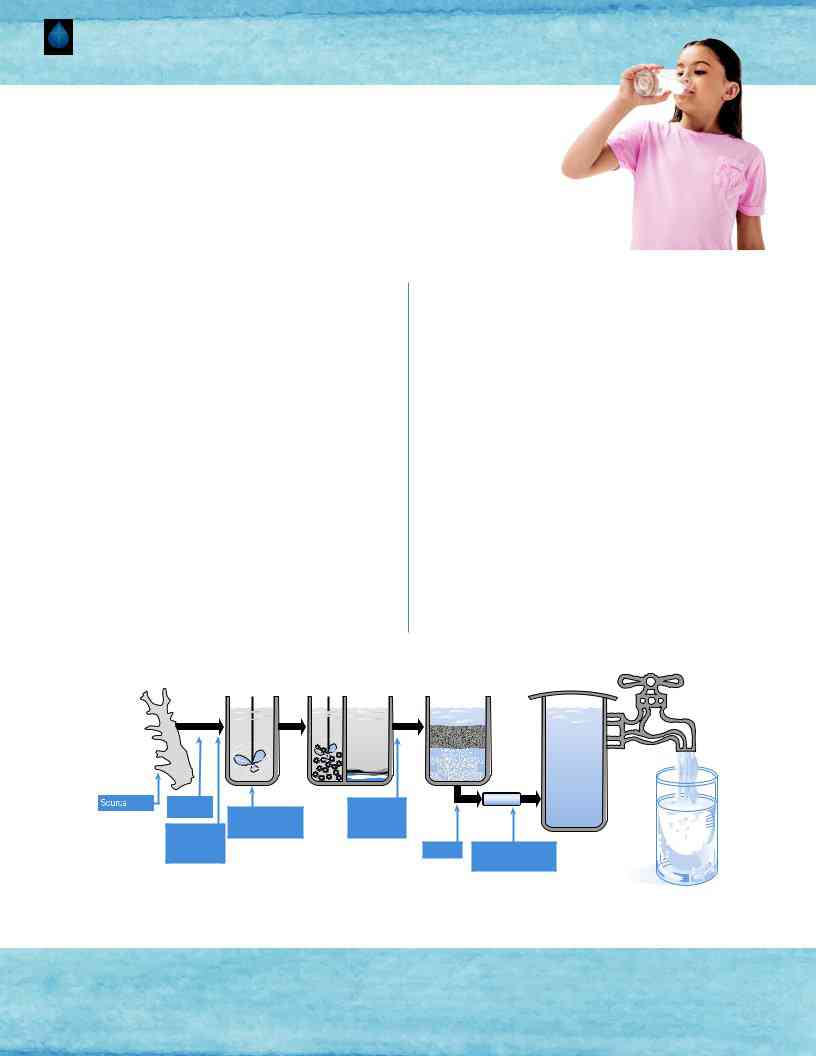
STAGES OF OUR WATER TREATMENT
Watershed protection: Protecting the watersheds prevents contamination
of our water supply and is the most
Extensive measures are taken to prevent contamination of our local and imported water. If you see “No Swimming” or “No Dumping” signs posted near water supplies, this is for the protection of your drinking water. The latest Watershed Sanitary Survey, which contains information on the City’s watersheds, including water quality and vulnerabilities, is available at:
Coagulation: This is the chemical process of rapidly mixing coagulants into the water entering the water treatment plant. Many of the particles in the source water have negative charges, causing them to repel each other, much like two magnets when the negative ends are put together. Coagulation changes these negative charges to neutral.
Flocculation: Coagulated water is slowly mixed causing the neutral particles
to collide. When the collisions occur, the particles clump together forming floc. As the floc is formed, particles in the water are trapped within the floc. The floc now looks like snowflakes suspended in the water.
Sedimentation: The floc particles are heavier than water. Mixing is stopped and the water slowly flows through the sedimentation basins, during which the floc settles to the bottom and is removed. The clear water is collected from the
top of the sedimentation basins.
Disinfection, Primary: Drinking water is further treated to remove or inactivate viruses, bacteria and other pathogenic organisms. Disinfection is accomplished in a variety of methods. The Alvarado and Miramar water treatment plants use ozone as the primary disinfectant. The Otay Water Treatment Plant uses chlorine dioxide as the primary disinfectant. These are advanced disinfection processes and have the advantage of providing higher quality water with better taste.
Filtration: Water is passed through deep filtration beds to produce water
that is crystal clear. Extremely small particles are removed during this process. San Diego’s water treatment plants produce water with turbidity (cloudiness)
significantly better than drinking water standards, indicating a highly effective
treatment process and resulting in
Disinfection, Secondary: Chloramines are created by adding chlorine and ammonia to the water. Chloramines help prevent microbial contamination from occurring in the water distribution system.
Corrosion Control: The corrosivity of the water is controlled by adjusting the pH.
Reservoir |
Coagulation |
Flocculation/ |
Filtration |
Treated |
Water |
||||
|
|
Sedimentation |
|
Storage |
Water |
|
|
Miramar |
Primary
Disinfection,
Chlorine Dioxide,
Otay WTP
Ferric Chloride
Polymer
Primary |
Disinfection, |
Ozone, Alvarado |
& Miramar WTP |
Anthracite Coal
Silica Sand
Support Media
Chlorine |
Ammonia |
|
Sodium Hydroxide |
|
Fluoride |
NOTICE OF VIOLATIONS
Under state law, the City of San Diego is required to collect at least 85 bacteriological water samples per week under the City’s Bacteriological Sample Siting Plan. On April 29, 2020, and May 5, 2020, the City of San Diego discovered that two laboratory technicians had falsified data by collecting multiple samples from single sample sites. Using GPS data collected from City vehicles, it was discovered that a total of 139 routine bacteriological samples were not collected during the months of December 2019 and April 2020 as scheduled in the City’s Bacteriological Sample Siting Plan. A complete incident report was submitted by the City to the state Department of Drinking Water on June 4, 2020. The State Water Board assessed an administrative penalty of $15,000 for the falsification of data.
A CHANGE FOR THE BETTER… |
|
|
|
|
|
|
SAN DIEGO |
|
|
|
|
|
THINK BLUE™ |
|
|
|
|
|
|
|
|
|
|
|
|
|
|
|
|
BEGINS
WITH
YOU.
Did you know that San Diego’s storm water system is separate from its water or wastewater system? Many people think that when water flows into a storm drain it is treated, but the storm drain system and the sewer system are not connected. Everything that enters storm drains flows untreated directly into our creeks, rivers, bays, beaches and ultimately the ocean.
That’s why Think Blue, the City of San Diego’s storm water outreach and education program, wants you to know that you have the power to keep trash, debris, sediments, metals, pesticides and other pollutants out of our storm drains and waterways by taking a few easy steps.
How You Can Help |
Our Storm Water System |
Sweep Up Around Your Yard: Sweep up dirt, debris and yard waste and dispose of them properly. Yard waste has the potential to carry hazardous landscaping chemicals such as pesticides and fertilizers into the storm drain system and generate large amounts of bacteria if left to decompose in gutters, drains and local waterways.
Eliminate
When It Rains: During the rainy season, redirect rain gutter downspouts to landscaped areas where the water can be absorbed and replenish groundwater or connect your downspout to a rain barrel to store the water for later use.
From Your Car: Your car can be a source of automotive pollutants such as motor oil. It’s important to check your car regularly for fluid leaks.
From Curb to Ocean: The City of San Diego oversees the operation and maintenance of 48,000 storm drain structures, 1,148 miles of pipe and 15 pump stations designed to control flooding by moving rain water away from the public and property to transport it to local waterways.
Aging Infrastructure: Maintenance of our storm water system is partially funded by a small storm water fee included in your water bill and supplemented by other City funds. It’s estimated that almost $900 million are needed in the next five years to fully fund the repairs and improvements required for the maintenance of this infrastructure and protect the quality of our waterways.
Vital to San Diego: A fully functional and operational modern storm water system is important to the environmental and economic health of San Diego and is essential to our quality of life.
Think Blue appreciates everything you do to help protect our local waterways. Visit ThinkBlue.org for more information on how you can prevent pollution in our waterways.
To report storm water pollution in San Diego, call the Think Blue Hotline at

8 Annual Drinking Water Quality Report 2020
Important Health Information
Some people may be more vulnerable to contaminants in drinking water than the general population. Immunocompromised persons such as persons with cancer undergoing chemotherapy, persons who have undergone organ transplants, people with HIV/AIDS or other immune system disorders, some elderly and infants can be particularly at risk from infections. These people should seek advice about drinking water from their health care providers. EPA/Centers for Disease Control (CDC) guidelines on appropriate means to lessen the risk of infection by Cryptosporidium and other microbial contaminants are available from the Safe Drinking Water Hotline
Drinking water, including bottled water, may reasonably be expected to contain at least small amounts of some contaminants. The presence of contaminants does not necessarily indicate that water poses a health
risk. More information about contaminants and potential health effects can be obtained by calling the EPA
Safe Drinking Water Hotline at
CRYPTOSPORIDIUM AND GIARDIA
Cryptosporidium and Giardia are microbial contaminants that are naturally present in the environment and found in surface water throughout the United States. Disinfection
and filtration are highly effective in removing these contaminants; however, the disinfection and filtration methods cannot guarantee 100% removal. During calendar year
2020, the water supply to each of the City’s water treatment plants was monitored for Cryptosporidium and Giardia, and neither was detected.
HOW TO READ THE TABLES
The tables on the following pages list parameters that DDW requires the City to monitor, which may be associated with primary (health), secondary (aesthetic) or no established standards. These tables summarize monitoring from January through December 2020. The tables list all parameters that were detected at or above DDW’s Detection Limit for Purposes of Reporting (DLR). The map on page 2 of this report can be used to determine the treatment plant or plants that supply water to your residence. Less than 10% of San Diego’s total water use comes from purchased treated water, which is a blend of water treated at the Metropolitan Water District’s Skinner Water Treatment Plant, the San Diego County Water Authority’s Twin Oaks Valley Water Treatment Plant, and the Carlsbad Desalination Plant.
DEFINITION OF TERMS
Action Level (AL): The concentration of a contaminant which, if exceeded, triggers treatment or other requirements that a water system must follow.
Maximum Contaminant Level (MCL): The highest level of a contaminant that is allowed in drinking water. Primary Maximum Contaminant Levels are set as close to the Public Health Goals or Maximum Contaminant Level Goals as is economically and technologically feasible. Secondary Maximum Contaminant Levels are set to protect the odor, taste and appearance of drinking water.
Maximum Contaminant Level Goal (MCLG): The level of a contaminant in drinking water below which there is no known or expected health risk. Maximum Contaminant Level Goals are set by the U.S. Environmental Protection Agency.
Maximum Residual Disinfectant Level (MRDL): The highest level of a disinfectant allowed in drinking water. There is convincing evidence that addition of a disinfectant is necessary for control of microbial contaminants.
Maximum Residual Disinfectant Level Goal (MRDLG): The level of a drinking water disinfectant below which there is no known or expected risk to health. Maximum Residual Disinfectant Level Goals do not reflect the benefits of the use of disinfectants to control microbial contaminants.
Notification Level (NL):
Public Health Goal (PHG): The level of a contaminant in drinking water that does not pose a significant risk to health. Public Health Goals are not regulatory standards.
Primary Drinking Water Standard (PDWS): Maximum Contaminant Levels, Maximum Residual Disinfection Levels and treatment techniques for contaminants that affect health, along with their monitoring and reporting requirements.
Treatment Technique (TT): A required process intended to reduce the level of a contaminant in drinking water.
ABBREVIATIONS
- absent
CA SMCL: California Secondary Maximum Contaminant Level
CU: color units
DLR: detection limit for reporting
gr/Gal: grains per gallon
MDL: City of San Diego Water Quality Laboratory Method Detection Limit –
the lowest quantifiable concentration of a measured parameter detectable by the laboratory.
mL: milliliter
n/a: not applicable
ND: not detected (less than DLR, where applicable)
NTU: nephelometric turbidity units
OU: odor units
pCi/L: picocuries per liter (a measure of radiation)
ppb: parts per billion or micrograms per liter (μg/L) – [1 ppb = 0.001 ppm]
ppm: parts per million or milligrams per liter (mg/L) – [1 ppm = 1,000 ppb]
μS/CM:
- less than
- greater than
Annual Drinking Water Quality Report 2020 9
ENVIRONMENTAL MONITORING AND TECHNICAL SERVICES
CONSUMER CONFIDENCE REPORT DATA - 2020
PRIMARY STANDARDS (MANDATORY HEALTH RELATED STANDARDS)
|
|
|
|
|
|
CITY OF SAN DIEGO TREATMENT PLANTS |
|
|
PURCHASED |
|
||||
|
|
|
|
|
|
|
|
|
|
|
|
TREATED WATER |
|
|
|
|
|
|
|
ALVARADO |
MIRAMAR |
|
OTAY |
MAJOR SOURCES |
|||||
|
|
|
|
|
|
|
|
|||||||
CHEMICAL PARAMETERS |
UNITS |
MCL |
PHG |
DLR |
AVERAGE |
RANGE |
AVERAGE |
RANGE |
AVERAGE |
|
RANGE |
AVERAGE |
RANGE |
IN DRINKING WATER |
Aluminum |
ppm |
1 |
0.6 |
0.05 |
ND |
ND - ND |
ND |
ND - ND |
ND |
|
ND - ND |
ND |
ND - 0.2 |
Erosion of natural deposits; |
|
residue from some surface water |
|||||||||||||
|
|
|
|
|
|
|
|
|
|
|
|
|
|
treatment processes |
Barium |
ppm |
1 |
2 |
0.1 |
ND |
ND - ND |
ND |
ND - 0.1 |
ND |
|
ND - ND |
ND |
ND - ND |
Erosion of natural deposits; |
|
discharges of oil drilling wastes |
|||||||||||||
|
|
|
|
|
|
|
|
|
|
|
|
|
|
|
Fluoride (naturally occurring) |
ppm |
2.0 |
1 |
0.1 |
0.3 |
0.2 - 0.4 |
0.2 |
0.1 - 0.4 |
0.3 |
|
0.2 - 0.5 |
0.4 |
0.1 - 1.0 |
Erosion of natural deposits |
|
|
|
|
|
|
|
|
|
|
|
|
|
|
|
Fluoride |
ppm |
2.0 |
1 |
0.1 |
0.5 |
0.4 - 0.7 |
0.4 |
0.1 - 0.7 |
0.5 |
|
0.4 - 0.6 |
0.7 |
0.5 - 0.9 |
Water additive that promotes |
|
strong teeth; erosion of natural |
|||||||||||||
|
|
|
|
|
|
|
|
|
|
|
|
|
|
deposits |
Nitrate (as N) |
ppm |
10 |
10 |
0.4 |
ND |
ND - ND |
ND |
ND - ND |
ND |
|
ND - 0.4 |
ND |
ND - 0.4 |
Runoff and leaching from |
|
fertilizer use; erosion of natural |
|||||||||||||
|
|
|
|
|
|
|
|
|
|
|
|
|
|
deposits |
Selenium |
ppb |
50 |
30 |
5 |
ND |
ND - ND |
ND |
ND - ND |
ND |
|
ND - ND |
ND |
ND - 6 |
Erosion of natural deposits; |
|
refineries, mines, and chemical |
|||||||||||||
|
|
|
|
|
|
|
|
|
|
|
|
|
|
waste discharge |
* Note: Optimal Fluoride Level as established by US Dept. of Health and Human Services and the State Water Resources Control Board is 0.7 ppm.
Primary standards (MCLs) are developed for the purpose of protecting the public from possible health risks associated with
California state law requires water agencies with more than 10,000 water service connections to supplement
|
|
|
|
|
|
CITY OF SAN DIEGO TREATMENT PLANTS |
|
|
PURCHASED |
|
|||||
|
|
|
PHG |
|
ALVARADO^ |
MIRAMAR^ |
|
OTAY^ |
TREATED WATER |
MAJOR SOURCES |
|||||
RADIOACTIVE PARAMETERS |
UNITS |
MCL |
(MCLG) |
DLR |
AVERAGE |
RANGE |
AVERAGE |
RANGE |
AVERAGE |
|
RANGE |
AVERAGE |
|
RANGE |
IN DRINKING WATER |
Gross Alpha Particle Activity |
pCi/L |
15 |
(0) |
3 |
ND |
ND - 5 |
3 |
Single Sample |
3 |
|
Single Sample |
ND |
|
ND - 3 |
Erosion of natural deposits |
|
|
|
|
|
|
|
|
|
|
|
|
|
|
|
|
Gross Beta Particle Activity |
pCi/L |
50* |
(0) |
4 |
ND |
ND - 6 |
5 |
Single Sample |
5 |
|
Single Sample |
ND |
|
ND - 5 |
Decay of natural and man- |
|
|
made deposits |
|||||||||||||
|
|
|
|
|
|
|
|
|
|
|
|
|
|
|
|
Radium 228 |
pCi/L |
0.019 |
1 |
ND |
ND - ND |
ND |
Single Sample |
ND |
|
Single Sample |
ND |
|
ND - 1 |
Erosion of natural deposits |
|
|
|
|
|
|
|
|
|
|
|
|
|
|
|
|
|
Uranium |
pCi/L |
20 |
0.43 |
1 |
2 |
2 - 2 |
1 |
Single Sample |
ND |
|
Single Sample |
1 |
|
ND - 2 |
Erosion of natural deposits |
|
|
|
|
|
|
|
|
|
|
|
|
|
|
|
|
* The State Water Resources Control Board |
considers |
50 pCi/L to be |
the level of concern for beta particles. |
|
^ Data from |
2020. Miramar and Otay Uranium and Radium 228 data from 2017. |
|
|
|||||||
As water travels over the surface of the land or in underground aquifers, it dissolves
liter (pCi/L), a standard measurement that represents an amount of radiation per liter of water. San Diego’s drinking water is substantially lower than the MCL for all radioactive parameters.
MICROBIOLOGICAL |
UNITS |
MCL |
MCLG |
DLR |
|
Total Coliform Bacteria |
% |
5% |
0 |
n/a |
|
State Total Coliform Rule |
Positive |
Positive |
|||
|
|
*Based on Monthly Percentages of Positive Total Coliform samples
CITY OF SAN DIEGO DISTRIBUTION SYSTEM
AVERAGE* |
RANGE* |
0.2% |
0 - 0.74% |
|
|
MAJOR SOURCES IN
DRINKING WATER
Naturally present in the environment
We are required to monitor your drinking water for specific contaminants on a regular basis. Results of regular monitoring are an indicator of whether your drinking water meets health standards. During December 2019 through April 2020, 139 of the 2,706 required distribution system sample sites were not monitored for total coliform and E. coli for reasons outside of our control. Therefore, we cannot be sure of the quality of the drinking water in the associated pressure zones during the weeks these sites were not monitored. However, we have since taken the required samples and put in place policies and tools to safeguard against similar occurrences in the future. Coliforms are bacteria that are naturally present in the environment and are used as an indicator that other,
DDW regulations require the City to test a minimum of 85 samples per week throughout our distribution system for total coliform bacteria, and to report the results, including the percentage of total coliform positive samples in a given month. To meet this requirement, in 2020 the City of San Diego collected and analyzed 6,784 total
coliform samples from the distribution system, an average of 130 per week. The test also examines the presence of E. coli, which is a subgroup of total coliform. The MCL for total coliform is the presence of coliform in 5% or more of the samples analyzed in one month, meaning that if 100 samples are collected in March and five contain total coliform, a violation of the MCL has occurred. The regulations are written as a percentage of monthly samples because multiple variables can cause a positive result, including localized contamination at the tap. In 2020, the City did not exceed the monthly MCL for total coliform. In fact, this has never occurred in the City’s system since this rule was established in 1989. The maximum value recorded in 2020 was 0.74 percent of monthly samples. When any sample tests positive for total coliform, three additional samples associated with that site are collected and the cause of the positive result is investigated.
Total Coliform Rule testing also examines the presence of E. coli, which is a subgroup of Total Coliform. All samples obtained from our distribution system in 2020 were absent of E. coli.
TURBIDITY |
UNITS |
MCL |
PHG |
|
Turbidity |
NTU |
TT = 1 NTU |
n/a |
|
|
|
|||
TT = 95% |
n/a |
|||
|
|
|||
|
|
of samples |
||
|
|
≤ 0.3 NTU |
|
CITY OF SAN DIEGO TREATMENT PLANTS |
PURCHASED |
||
ALVARADO |
MIRAMAR |
OTAY |
TREATED WATER |
Max Level Found = 0.20 |
Max Level Found = 0.10 |
Max Level Found = 0.08 |
Max Level Found = 0.09 |
100% of samples ≤ 0.3 |
100% of samples ≤ 0.3 |
100% of samples ≤ 0.3 |
100% of samples ≤ 0.3 |
|
|
|
|
MAJOR SOURCES IN DRINKING WATER
Soil runoff
Turbidity is a measure of the cloudiness of the water and is regulated as a Treatment Technique (TT) – an indicator of the effectiveness of our treatment. The City’s three water treatment plants (WTPs) monitor turbidity every 15 minutes to ensure consistent,
- performance goals established by DDW state that all samples should have turbidity less than 1 NTU, and 95% of the samples should have turbidity less than 0.3 NTU. All three of our treatment plants had 100% of turbidity values less than 0.3 NTU; the maximum values measured in 2020 were 0.20 NTU for Alvarado WTP, 0.10 NTU for Miramar WTP and 0.08 for Otay WTP. These consistent and very low turbidity results have led
to our treatment plants receiving performance awards. For example:
- The Otay WTP has been awarded the Director’s Award from the American Water Works Association (AWWA) Partnership for Safe Water (PSW) Program for thirteen consecutive years.
- The Miramar WTP has received the Director’s Award for nine years and the President’s Award for eight consecutive years.
-
Our
award-winning Alvarado Treatment Plant participates in the PSW program, meeting all turbidity standards.

10 Annual Drinking Water Quality Report 2020
CONTINUED: PRIMARY STANDARDS (MANDATORY HEALTH RELATED STANDARDS)
|
|
|
|
|
SAMPLES TAKEN FROM CUSTOMER TAPS |
|
Number of |
|
||||
LEAD AND |
|
ACTION |
|
|
90th PERCENTILE |
SAMPLING SITES |
NUMBER |
VIOLATION |
Schools Sampled |
|
||
COPPER STUDY |
UNITS |
LEVEL |
PHG |
DLR |
CONCENTRATION |
EXCEEDING AL |
for Lead |
MAJOR SOURCES IN DRINKING WATER |
||||
|
|
|||||||||||
Copper |
ppm |
1.3 |
0.3 |
0.05 |
0.4 |
54 |
0 |
NO |
281* |
|
Internal corrosion of household plumbing systems |
|
|
|
|
|
|
|
|
|
|
|
|
||
Lead |
ppb |
15 |
0.2 |
5 |
ND |
54 |
0 |
NO |
|
Internal corrosion of household plumbing systems |
||
|
|
|||||||||||
Note: Lead and Copper Rule Monitoring mandated every three years. Most recent monitoring conducted in 2020.
In addition to the EPA Lead and Copper study and schools sampling, the City of San Diego analyzed 72 samples from our three drinking water treatment plants in 2020. All results were below the DLR. * Represents total number of schools sampled in 2017, 2018, and 2019.
Lead and copper are at Non Detectable levels in the water produced at San Diego’s water treatment plants, but can enter drinking water through plumbing materials used in homes or businesses. Exposure to lead and copper may cause health problems ranging from stomach distress to brain damage. In 1991, the EPA published the Lead and Copper Rule (LCR) which, along with corrosion control and other treatment practices, requires monitoring of lead and copper at customer taps. The purpose of the LCR residential sampling is to assess the potential of lead and copper to leach into drinking water from the plumbing installed between the water meter and the tap in homes and businesses. If lead concentrations at customer taps exceed an Action Level (AL) of 15 ppb or copper concentrations exceed an AL of 1.3 ppm in more than 10% of taps sampled, we are required to inform the public and undertake a number of additional actions to ensure comprehensive corrosion control.
If present, elevated levels of lead can cause serious health problems, especially for pregnant women and young children. Lead in drinking water is primarily from materials and components associated with service lines and home plumbing. The City of San Diego is responsible for providing high quality drinking water, but cannot control the variety of materials used in plumbing components. When your water has been sitting for several hours, you can minimize the potential for lead exposure by flushing your tap for 30 seconds
to two minutes before using water for drinking or cooking. If you are concerned about lead in your water, you may wish to have your water tested. Information on lead in drinking water, testing methods, and steps you can take to minimize exposure is available from the Safe Drinking Water Hotline at
Lead and Copper Rule monitoring must be conducted every three years. In 2020 54 customers provided samples from their taps to the City of San Diego for lead and copper analysis. None of the residences had a copper or lead result above the AL. Because less than 10% of our results were above the AL for both lead and copper, our water is considered
In 2017, DDW issued a Permit Amendment requiring water utilities to sample for lead in the drinking water of any school requesting testing. Additionally, Assembly Bill 746 was signed into law in October 2017, requiring California water providers to conduct lead testing at public
DETECTED DISINFECTION BYPRODUCTS, DISINFECTANT RESIDUAL AND DISINFECTION
|
|
|
|
|
|
|
CITY OF SAN DIEGO TREATMENT PLANTS |
|
PURCHASED |
|
|||||
|
|
|
|
|
|
ALVARADO |
MIRAMAR |
OTAY |
TREATED WATER |
MAJOR SOURCES IN |
|||||
|
|
UNITS |
MCL |
PHG |
DLR |
AVERAGE |
RANGE |
AVERAGE |
RANGE |
AVERAGE |
RANGE |
AVERAGE |
|
RANGE |
DRINKING WATER |
Bromate* |
|
ppb |
10 |
0.1 |
5.0/1.0*** |
ND |
ND - 9.7 |
ND |
ND - ND |
n/a |
n/a |
2.7 |
|
ND - 7.4 |
Byproduct of drinking |
|
|
water disinfection |
|||||||||||||
|
|
|
|
|
|
|
|
|
|
|
|
|
|
|
|
Chlorate |
|
ppb |
NL=800 PPB |
20 |
n/a |
n/a |
n/a |
n/a |
173 |
95.1 - 334 |
145 |
|
34 - 290 |
Byproduct of drinking |
|
|
|
water disinfection |
|||||||||||||
|
|
|
|
|
|
|
|
|
|
|
|
|
|
|
|
Chlorite** |
|
ppm |
1.0 |
0.05 |
0.020 |
n/a |
n/a |
n/a |
n/a |
0.35 |
0.17 - 0.62 |
n/a |
|
n/a |
Byproduct of drinking |
|
|
water disinfection |
|||||||||||||
|
|
|
|
|
|
|
|
|
|
|
|
|
|
|
|
|
|
|
|
|
|
|
|
|
|
|
|
|
|
|
Various natural and |
Total Organic Carbon (TOC) |
ppm |
TT |
n/a |
0.3 |
3.1 |
2.5 - 3.8 |
2.7 |
2.0 - 4.2 |
3.8 |
2.0 - 5.4 |
2.5**** |
|
1.9 - 2.6 |
manmade sources; TOC is a |
|
|
precursor for the formation |
||||||||||||||
|
|
|
|
|
|
|
|
|
|
|
|
|
|
|
|
|
|
|
|
|
|
|
|
|
|
|
|
|
|
|
of disinfection byproducts |
* Required for Alvarado, Miramar, and |
Purchased Treated Water; compliance is determined by the quarterly Running Annual Average (RAA) |
|
|
|
|
|
|
|
|||||||
** Required for Otay |
***City of San Diego DLR= 5, Purchased Treated Water DLR = 1 |
****Highest Running Annual Average |
|
|
|
|
|
|
|
||||||
|
|
|
|
|
|
|
|
|
|
|
|
|
|
||
|
|
|
MCL |
PHG |
DLR |
|
|
CITY OF SAN DIEGO DISTRIBUTION SYSTEM |
|
|
|
MAJOR SOURCES IN |
|||
|
|
UNITS |
[MRDL] |
[MRDLG] |
(MDL) |
|
|
|
|
|
|
|
|
|
DRINKING WATER |
Disinfectant Residual |
|
ppm |
[4.0]B |
[4] |
(0.1) |
Distribution system average = 2.0 |
Range = ND - 3.8 |
|
Drinking water disinfectant |
||||||
(Chloramines as Cl2) |
|
|
|
|
|
|
|
|
|
|
|
|
|
|
added for treatment |
ChloriteA |
|
ppm |
1.0 |
0.05 |
0.020 |
Distribution system average = 0.32 |
Range = 0.14 - 0.44 |
|
Byproduct of drinking water |
||||||
|
|
|
|
|
|
|
|
|
|
|
|
|
|
|
disinfection |
Haloacetic Acids (HAA5) |
ppb |
60C |
n/a |
|
Maximum LRAA = 14 |
|
Range = ND - 22 |
Violation - NO |
Byproduct of drinking water |
||||||
|
|
|
|
|
|
|
|
|
|
|
|
|
|
|
disinfection |
Total Trihalomethanes (TTHMs) |
ppb |
80C |
n/a |
|
Maximum LRAA = 46 |
|
Range = 8.8 – 65.6 |
Violation - NO |
Byproduct of drinking water |
||||||
|
|
|
|
|
|
|
|
|
|
|
|
|
|
|
chlorination |
- Chlorite monitoring required only in the Southern section of the distribution system.
- Compliance is determined by the distribution system average.
- Total Trihalomethane and HAA5 compliance is based on quarterly Locational Running Annual Averages (LRAA)
Drinking water must be disinfected to ensure that any potentially harmful microbes are neutralized. There are a variety of disinfection strategies used throughout the United States. San Diego utilizes some of the more advanced disinfection technologies available. Our Alvarado and Miramar water treatment plants use ozone and chloramines for disinfection. Ozone produces fewer disinfection byproducts than chlorine or chloramines alone and is considered a superior disinfection method. However, all disinfectant strategies have the potential to create a byproduct. When ozone is used, bromate is monitored as a disinfection byproduct. The City’s Otay WTP uses chlorine dioxide and chloramines for disinfection. When chlorine dioxide is used, chlorite is monitored as a disinfection byproduct in the plant effluent and distribution system. All 2020 results for bromate and chlorite are below the MCLs. Total Organic Carbon (TOC) has no health effects. It is monitored and reported here because it provides an assessment of potential disinfection byproduct formation.
As drinking water travels from the City’s WTPs through the distribution system to homes and businesses, a disinfectant residual must be maintained in order to prevent growth of potentially harmful microbes.
In San Diego, chloramines are used for this purpose. The City performs frequent and comprehensive monitoring to ensure that disinfectant levels remain in the proper range throughout our large and complex distribution system. The Maximum Residual Disinfectant Level (MRDL) is 4.0 ppm. In 2020 the City analyzed 7751 samples for chloramines throughout the distribution system; the average residual was 2.0 ppm and the maximum was 3.8 ppm.
Another category of disinfection byproducts that the EPA and DDW regulate are Total Trihalomethanes (THMs) and Haloacetic Acids (HAA5). Compliance with EPA’s Stage 2 Disinfection ByProduct (DBP) rule is based on the running annual average at each location monitored in the distribution system. The MCL for THMs is an LRAA of 80 ppb, and the MCL for HAA5 is an LRAA of 60 ppb. The City has had no violations of the EPA Stage 1 and Stage 2 DBP MCLs since the program was formalized in 2002. In 2020, our highest LRAA for TTHM was 46 ppb, and individual measurements ranged from 8.8 to 65.6 ppb. For HAA5, our highest LRAA was 14 ppb, and individual measurements ranged from ND to 22 ppb.
Annual Drinking Water Quality Report 2020 11
SECONDARY STANDARDS (AESTHETICS STANDARDS)
|
|
|
|
|
CITY OF SAN DIEGO TREATMENT PLANTS |
|
|
PURCHASED |
|
||||
|
|
CA |
DLR |
ALVARADO |
MIRAMAR |
|
OTAY |
TREATED WATER |
|
||||
|
UNITS |
SMCL |
(MDL) |
AVERAGE |
RANGE |
AVERAGE |
RANGE |
AVERAGE |
|
RANGE |
AVERAGE |
RANGE |
MAJOR SOURCES IN DRINKING WATER |
Aluminum |
ppb |
200 |
50 |
ND |
ND - ND |
ND |
ND - ND |
ND |
|
ND - ND |
ND |
ND - 200 |
Erosion of natural deposits; residue from |
|
some surface water treatment processes |
||||||||||||
|
|
|
|
|
|
|
|
|
|
|
|
|
|
Chloride |
ppm |
500 |
(0.5) |
99.5 |
88.0 - 108 |
93.9 |
80.5 - 103 |
139 |
|
103 - 180 |
79.2 |
54.0 - 100 |
Runoff/leaching from natural deposits; |
|
seawater influence |
||||||||||||
|
|
|
|
|
|
|
|
|
|
|
|
|
|
Color |
CU |
15 |
(1) |
ND |
ND - 2 |
ND |
ND - 1 |
1 |
|
ND - 3 |
ND |
ND - 2 |
Naturally - occurring organic materials |
|
|
|
|
|
|
|
|
|
|
|
|
|
|
Odor - Threshold |
OU |
3 |
1 |
ND |
ND - 1 |
ND |
ND - ND |
1 |
|
1 - 1 |
ND |
ND - 2 |
Naturally - occurring organic materials |
|
|
|
|
|
|
|
|
|
|
|
|
|
|
Specific Conductance |
μS/cm |
1,600 |
n/a |
831 |
769 - 859 |
777 |
563 - 923 |
923 |
|
845 - 1040 |
647 |
292 - 956 |
Substances that form ions when in water; |
|
seawater influence |
||||||||||||
|
|
|
|
|
|
|
|
|
|
|
|
|
|
Sulfate |
ppm |
500 |
0.5 |
155 |
123 - 176 |
144 |
72.8 - 202 |
135 |
|
89.5 - 187 |
92.0 |
12.0 - 208 |
Runoff/leaching from natural deposits; |
|
industrial wastes |
||||||||||||
|
|
|
|
|
|
|
|
|
|
|
|
|
|
Total Dissolved Solids |
ppm |
1000 |
(10) |
515 |
468 - 553 |
477 |
352 - 564 |
556 |
|
506 - 620 |
345 |
140 - 588 |
Runoff/leaching from natural deposits |
|
|
|
|
|
|
|
|
|
|
|
|
|
|
Secondary standards (Secondary MCLs) are set to protect the odor, taste, and appearance of drinking water. If present at or above the Secondary MCL, these parameters may cause the water to appear cloudy or colored, or to have a different or unusual taste or odor. These parameters are not considered to present
a risk to human health at or above Secondary MCL levels. All measurements of Secondary Standards were at or below the Secondary MCL in 2020.
OTHER PARAMETERS THAT MAY BE OF INTEREST
|
|
|
|
|
|
|
|
CITY OF SAN DIEGO TREATMENT PLANTS |
|
|
PURCHASED TREATED WATER |
|||||
|
|
|
|
|
ALVARADO |
|
|
MIRAMAR |
|
|
OTAY |
|
||||
|
|
|
|
|
|
|
|
|
|
|
|
|||||
|
UNITS |
MCL |
PHG |
MDL |
AVERAGE |
RANGE |
|
AVERAGE |
RANGE |
AVERAGE |
RANGE |
AVERAGE |
RANGE |
|||
Sodium |
ppm |
n/a |
n/a |
20 |
87.6 |
75.9 |
|
81.8 |
62.5 |
- 90.3 |
105 |
95.0 - 128 |
68.4 |
45.4 - 98.0 |
||
|
|
|
|
|
|
|
|
|
|
|
|
|
|
|
|
|
Total Hardness |
ppm |
n/a |
n/a |
10 |
236 |
203 |
- 255 |
|
218 |
127 |
- 277 |
235 |
175 |
- 293 |
145 |
41.7 - 273 |
|
|
|
|
|
|
|
|
|
|
|
|
|
|
|
|
|
Total Hardness |
gr/Gal |
n/a |
n/a |
0.6 |
13.8 |
11.9 |
- 14.9 |
|
12.7 |
7.42 |
- 16.2 |
13.7 |
10.2 |
- 17.1 |
8.47 |
2.44 - 15.9 |
|
|
|
|
|
|
|
|
|
|
|
|
|
|
|
|
|
Alkalinity - Total as CaCO3 |
ppm |
n/a |
n/a |
20 |
126 |
112 |
- 150 |
|
112 |
83.2 - 139 |
125 |
110 |
- 144 |
91.5 |
46.0 - 121 |
|
pH |
pH |
n/a |
n/a |
n/a |
8.06 |
6.84 |
- 8.46 |
|
8.20 |
7.59 |
- 8.61 |
8.18 |
7.46 |
- 8.74 |
8.14 |
7.40 - 8.80 |
|
|
|
|
|
|
|
|
|
|
|
|
|
|
|
|
|
Water quality parameters that may be of interest to our consumers, but do not have MCLs or PHGs and are not considered to present a risk to human health, are included in the table above. Although sodium and hardness do not have MCLs, they are of interest to many consumers who are concerned about sodium intake and may believe that the hardness of the water could affect their health. Therefore, monitoring and
reporting are required by DDW. Sodium refers to the salt present in the water and is generally naturally occurring. Hardness is the sum of
DETECTED UNREGULATED PARAMETERS
|
|
NOTIFICA- |
|
|
CITY OF SAN DIEGO TREATMENT PLANTS |
|
PURCHASED TREATED WATER |
||||
|
|
TION |
DLR |
ALVARADO |
MIRAMAR |
|
OTAY |
|
|
||
|
UNITS |
LEVEL |
(PHG) |
AVERAGE |
RANGE |
AVERAGE |
RANGE |
AVERAGE |
RANGE |
AVERAGE |
RANGE |
Boron |
ppm |
1 |
0.1 |
0.1 |
0.1 - 0.1 |
0.1 |
0.1 - 0.1 |
0.2 |
0.2 - 0.2 |
0.3 |
0.1 - 0.8 |
|
|
|
|
|
|
|
|
|
|
|
|
ppt |
10 |
(3) |
n/a |
n/a |
n/a |
n/a |
n/a |
n/a |
2 |
ND - 4.2 |
|
|
|
|
|
|
|
|
|
|
|
|
|
Chromium, hexavalent (CrVI) |
ppb |
(0.02)* |
0.06 |
Single Sample |
0.05 |
Single Sample |
0.03 |
Single Sample |
ND |
ND - ND |
|
|
|
|
|
|
|
|
|
|
|
|
|
* The DLR of 1 ppb and the MCL of 10 ppb for Chromium VI were repealed in 2017. The value listed here is the PHG for Chromium VI.
UCMR4 STUDY
|
|
UCMR4 |
|
|
CITY OF SAN DIEGO TREATMENT PLANTS |
|
|
CITY OF SAN DIEGO |
|||||
|
|
MRL |
ALVARADO |
|
MIRAMAR |
|
|
OTAY |
DISTRIBUTION SYSTEM |
||||
UCMR4 PARAMETERS1 |
UNITS |
(MDL) |
AVERAGE |
RANGE |
|
AVERAGE |
RANGE |
AVERAGE |
RANGE |
MAX LRAA |
|
RANGE |
|
Bromide* |
ppm |
(0.02) |
0.10 |
0.05 - 0.16 |
|
0.06 |
0.04 |
- 0.11 |
0.20 |
0.04 - 0.35 |
n/a |
|
n/a |
|
|
|
|
|
|
|
|
|
|
|
|
|
|
Manganese |
ppb |
0.4 |
2.2 |
ND - 8.2 |
|
0.9 |
0.6 |
- 1.2 |
0.2 |
ND - 0.7 |
n/a |
|
n/a |
|
|
|
|
|
|
|
|
|
|
|
|
|
|
Total Organic Carbon (TOC)* |
ppm |
(1) |
3.2 |
2.7 - 3.7 |
|
2.7 |
2.6 |
- 2.9 |
4.9 |
2.6 - 7.0 |
n/a |
|
n/a |
|
|
|
|
|
|
|
|
|
|
|
|
|
|
HAA9** |
ppb |
n/a |
n/a |
n/a |
|
n/a |
n/a |
n/a |
n/a |
26 |
|
4.1 - 40 |
|
|
|
|
|
|
|
|
|
|
|
|
|
|
|
1 UCMR4 samples were collected in 2018
* As measured in untreated plant influent
** HAA9 is the sum of bromochloroacetic acid, bromodichloroacetic acid, chlorodibromoacetic acid, dibromoacetic acid, dichloroacetic acid, monobromoacetic acid, monochloroacetic acid, tribromoacetic acid, and trichloroacetic acid.
The parameters listed in the Detected Unregulated Parameters section are not regulated by DDW or the EPA, and monitoring is not required. Unregulated contaminant monitoring helps U.S. EPA and the State Water Resources Control Board to determine where certain contaminants occur and whether the contaminants need to be regulated. Boron and
As part of the 1996 Safe Drinking Water Act (SDWA) amendments, every five years EPA selects from the Contaminant Candidate List (CCL) up to 30 unregulated contaminants to be monitored by public water systems as part of the
Unregulated Contaminant Monitoring Rule (UCMR) program. The CCL is a list of contaminants that are not regulated but are known or anticipated to occur in public water systems, and may warrant future regulation under the Safe Drinking Water Act. The results of UCMR studies provide a basis for future regulatory actions to protect public health. The City of San Diego conducted UCMR4 sampling in 2018.
San Diego’s drinking water was tested by an
Public Utilities Department
9192 Topaz Way
San Diego, CA 92123
Quality | Value | Reliability | Customer Service
PRESORTED
STANDARD
U.S. POSTAGE
PAID
SAN DIEGO, CA PERMIT 134
This report contains important information about your drinking water. Translate it, or speak with someone who understands it.
Spanish
Este informe contiene información muy importante sobre su agua potable.
Tradúzcalo o hable con alguien que lo entienda bien.
Arabic
Chinese (Traditional)
Chinese (Simplified)
Farsi
French
Cé rapport contient des information importantes concernant votre eau potable. Veuillez traduire, ou parlez avec quelqu’ un qui peut le comprendre.
Hmong
Daimntawv tshaj tawm no muaj lus tseemceeb txog koj cov dej haus.
Tshab txhais nws, los yog tham nrog tej tug neeg uas totaub txog nws.
JapaneseKhamer
Korean
Laotian
Russian
Swahili
Shauri hii niya kufahamisha uzuri wa maji ya kunyua.
Shauri nilazima egeuzwe kwa yoyote hajui Kiingereza.
Tagalog
Mahalaga ang impormasyong ito. Mangyaring ipasalin ito.
Vietnamese
This information is available in alternative formats upon request. |
Printed on recycled paper |
Contaminants
Otay Water District
EWG's drinking water quality report shows results of tests conducted by the water utility and provided to the Environmental Working Group by the California State Water Resources Control Board, as well as information from the U.S. EPA Enforcement and Compliance History database (ECHO). For the latest quarter assessed by the U.S. EPA (January 2019 - March 2019), tap water provided by this water utility was in compliance with federal health-based drinking water standards.
Utility details
- Serves: 213000
- Data available: 2012-2017
- Data Source: Purchased surface water
- Total: 18
Contaminants That Exceed Guidelines
- Bromodichloromethane
- Bromoform
- Chloroform
- Chromium (hexavalent)
- Dibromochloromethane
- Dichloroacetic acid
- Total trihalomethanes (TTHMs)
- Trichloroacetic acid
Other Detected Contaminants
- Bromochloroacetic acid
- Chlorate
- Dibromoacetic acid
- Fluoride
- Haloacetic acids (HAA5)
- Molybdenum
- Monochloroacetic acid
- Strontium
- Uranium
- Vanadium
Reminder
Always take extra precautions, the water may be safe to drink when it leaves the sewage treatment plant but it may pick up pollutants during its way to your tap. We advise that you ask locals or hotel staff about the water quality. Also, note that different cities have different water mineral contents.
Sources and Resources
Sources Cited
Additional Resources
Is San Diego Tap Water Safe to Drink?
Yes, San Diego's tap water is generally considered safe to drink as it met the EPA’s water quality mandates in its 2020 Water Quality Report. From April 1, 2018 to June 30, 2021 San Diego Water Utility had one Safe Drinking Water Act Violation, which a monitoring violation, and has been resolved. One should not get sick from drinking San Diego tap water.
Though San Diego's tap water is generally safe to drink, one should consider the possible safety impacts of low levels of regulated contaminants, unregulated contaminants, and water quality issues caused by severe weather.
While San Diego's tap water is generally safe to drink, long-term residents may consider using water filters for their everyday drinking, as the EPA is still assessing the health impacts of long-term exposure to certain contaminants that they do not yet have regulations for, and long term exposure to certain contaminants which are already regulated, but below the currently acceptable levels.
Where Does San Diego Tap Water Come From?
According to San Diego's 2020 Water Quality Report, the City of San Diego currently imports most of its water supply, the bulk of which is raw (untreated) water purchased from the San Diego County Water Authority. All raw water is treated before entering the City’s drinking water distribution system. Less than 10% of the imported water purchased from the County Water Authority is a blend of treated water from the Metropolitan Water District’s Skinner Water Treatment Plant, the County Water Authority’s Twin Oaks Valley Water Treatment Plant and the Carlsbad Desalination Plant. Most of the imported water from the County Water Authority is a blend from the Colorado River and State Water Project (see map to the left). Throughout the year, the ratio of water from each source changes. The constituents that make up the City’s source water are influenced by the water source, climate, geology and the land activities that they flow through. The City continually monitors our source water and adjusts its treatment process to ensure that the water is always healthy and safe.
Main Contaminants Found in San Diego Tap Water
As we mentioned above, San Diego tap water meets the requirements set by the EPA. For more precise information please see their 2020 water quality report. Though San Diego drinking water meets EPA standards that does not mean it is contaminant free as there are levels that the EPA considers acceptable. Though the EPA regulated contaminants must meet a certain threshold for the city’s water to be deemed acceptable, many are still present in the drinking water at some level. The EPA continues to evaluate the long term impacts of these chemicals as more research is available. For example, the rules around arsenic, as well as, lead and copper are currently being re-evaluated.
Additionally, there are a number of “emerging†contaminants that the EPA has not determined acceptable levels for and is currently researching. For example, Per- and polyfluoroalkyl substances (PFAS), for which the EPA has issued a health advisory. PFAS are also called ‘forever chemicals’ since they tend not to break down in the environment or the human body and can accumulate over time. We do not yet fully understand the dangers of PFAS as they are currently being investigated. San Diego has at least one suspected PFAS leak, so there is potential that they could have made their way into San Diego's drinking water.
Lead piping is another potential source of contamination for many homes, both through service lines and in your home. The National Resource Defense Council has a great walk-through on how to determine if you may have lead service lines.
So while San Diego's tap water does meet the requirements set by the EPA, it still makes sense to try to purify the tap water further to reduce contaminants to lower levels.
Is San Diego Tap Water Safe to Drink?
Yes, San Diego’s tap water is generally considered safe to drink as it met the EPA’s water quality mandates in its 2020 Water Quality Report. From April 1, 2018 to June 30, 2021 San Diego Water Utility had one Safe Drinking Water Act Violation, which a monitoring violation, and has been resolved. One should not get sick from drinking San Diego tap water.
Though San Diego’s tap water is generally safe to drink, one should consider the possible safety impacts of low levels of regulated contaminants, unregulated contaminants, and water quality issues caused by severe weather.
While San Diego’s tap water is generally safe to drink, long-term residents may consider using water filters for their everyday drinking, as the EPA is still assessing the health impacts of long-term exposure to certain contaminants that they do not yet have regulations for, and long term exposure to certain contaminants which are already regulated, but below the currently acceptable levels.
Where Does San Diego Tap Water Come From?
According to San Diego’s 2020 Water Quality Report, the City of San Diego currently imports most of its water supply, the bulk of which is raw (untreated) water purchased from the San Diego County Water Authority. All raw water is treated before entering the City’s drinking water distribution system. Less than 10% of the imported water purchased from the County Water Authority is a blend of treated water from the Metropolitan Water District’s Skinner Water Treatment Plant, the County Water Authority’s Twin Oaks Valley Water Treatment Plant and the Carlsbad Desalination Plant. Most of the imported water from the County Water Authority is a blend from the Colorado River and State Water Project (see map to the left). Throughout the year, the ratio of water from each source changes. The constituents that make up the City’s source water are influenced by the water source, climate, geology and the land activities that they flow through. The City continually monitors our source water and adjusts its treatment process to ensure that the water is always healthy and safe.
Main Contaminants Found in San Diego Tap Water
As we mentioned above, San Diego tap water meets the requirements set by the EPA. For more precise information please see their 2020 water quality report. Though San Diego drinking water meets EPA standards that does not mean it is contaminant free as there are levels that the EPA considers acceptable. Though the EPA regulated contaminants must meet a certain threshold for the city’s water to be deemed acceptable, many are still present in the drinking water at some level. The EPA continues to evaluate the long term impacts of these chemicals as more research is available. For example, the rules around arsenic, as well as, lead and copper are currently being re-evaluated.
Additionally, there are a number of “emerging” contaminants that the EPA has not determined acceptable levels for and is currently researching. For example, Per- and polyfluoroalkyl substances (PFAS), for which the EPA has issued a health advisory. PFAS are also called ‘forever chemicals’ since they tend not to break down in the environment or the human body and can accumulate over time. We do not yet fully understand the dangers of PFAS as they are currently being investigated. San Diego has at least one suspected PFAS leak, so there is potential that they could have made their way into San Diego’s drinking water.
Lead piping is another potential source of contamination for many homes, both through service lines and in your home. The National Resource Defense Council has a great walk-through on how to determine if you may have lead service lines.
So while San Diego’s tap water does meet the requirements set by the EPA, it still makes sense to try to purify the tap water further to reduce contaminants to lower levels.