Table of Contents
Can You Drink Tap Water in Redlands?
Yes, Redlands's tap water is generally considered safe to drink as Redlands has no active health based violations of the Safe Drinking Water Act (SDWA) that we are aware of. Other factors such as lead piping in a home, or low levels of pollutants on immunocompromised individuals, should also be considered, however. To find more recent info we might have, you can check out our boil water notice page or the city's water provider website.
According the EPA’s ECHO database, from April 30, 2019 to June 30, 2022, Redlands's water utility, Redlands City Mud-Water Div, had 0 violations of the Safe Drinking Water Act. For more details on the violations, please see our violation history section below. This assessment is based on the Redlands City Mud-Water Div water system, other water systems in the city may have different results.
While tap water that meets the EPA health guidelines generally won’t make you sick to your stomach, it can still contain regulated and unregulated contaminants present in trace amounts that could potentially cause health issues over the long-run. These trace contaminants may also impact immunocompromised and vulnerable individuals.
The EPA is reviewing if it’s current regulations around pollutant levels in tap water are strict enough, and the health dangers posed by unregulated pollutants, like PFAS.
Water Quality Report for Redlands Tap Water
The most recent publicly available numbers for measured contaminant levels in Redlands tap water are in its 2020 Water Quality Report. As you can see, there are levels which the EPA considers to be acceptable, but being below the maximum allowable level doesn’t necessarily mean the water is healthy.
Lead in tap water, for example, is currently allowed at up to 15ppb by the EPA, but it has set the ideal goal for lead at zero. This highlights how meeting EPA standards doesn’t necessarily mean local tap water is healthy.
EPA regulations continue to change as it evaluates the long term impacts of chemicals and updates drinking water acceptable levels. The rules around arsenic, as well as, lead and copper are currently being re-evaluated.
There are also a number of "emerging" contaminants that are not currently. For example, PFAS (Per- and polyfluoroalkyl substances), for which the EPA has issued a health advisory. PFAS are called "forever chemicals" since they tend not to break down in the environment or the human body and can accumulate over time.
We recommend looking at the contaminants present in Redlands's water quality reports, or getting your home's tap water tested to see if you should be filtering your water.
Redlands Tap Water Safe Drinking Water Act Violation History - Prior 10 Years
Below is a ten year history of violations for the water system named Redlands City Mud-Water Div for Redlands in California. For more details please see the "What do these Violations Mean?" section below.
Is there Lead in Redlands Water?
Based on the EPA’s ECHO Database, 90% of the samples taken from the Redlands water system, Redlands City Mud-Water Div, between sample start date and sample end date, were at or below, 0.0 mg/L of lead in Redlands water. This is 0% of the 0.015 mg/L action level. This means 10% of the samples taken from Redlands contained more lead.
While Redlands water testing may have found 0.0 mg/L of lead in its water, that does not mean your water source has the same amount. The amount of lead in water in a city can vary greatly from neighborhood to neighborhood, or even building to building. Many buildings, particularly older ones, have lead pipes or service lines which can be a source of contamination. To find out if your home has lead, we recommend getting you water tested.
No amount of lead in water is healthy, only less dangerous. As lead accumulates in our bodies over time, even exposure to relatively small amounts can have negative health effects. For more information, please check out our Lead FAQ page.
Are there PFAS in Redlands Tap Water?
Currently, testing tap water for PFAS isn’t mandated on a national level. We do have a list of military bases where there have been suspected or confirmed leaks. There appears to be at least one military base - Norton Air Force Base - near Redlands with suspected leaks.
With many potential sources of PFAS in tap water across the US, the best information we currently have about which cities have PFAS in their water is this ewg map, which you can check to see if Redlands has been evaluated for yet.
Our stance is better safe than sorry, and that it makes sense to try to purify the tap water just in case.
What do these Violations Mean?
Safe Drinking Water Act Violations categories split into two groups, health based, and non-health based. Generally, health based violations are more serious, though non-health based violations can also be cause for concern.
Health Based Violations
- Maximum contaminant levels (MCLs) - maximum allowed contaminant level was exceeded.
- Maximum residual disinfectant levels (MRDLs) - maximum allowed disinfectant level was exceeded.
- Other violations (Other) - the exact required process to reduce the amounts of contaminants in drinking water was not followed.
Non-Health Based Violations
- Monitoring and reporting violations (MR, MON) - failure to conduct the required regular monitoring of drinking water quality, and/or to submit monitoring results on time.
- Public notice violations (Other) - failure to immediately alert consumers if there is a serious problem with their drinking water that may pose a risk to public health.
- Other violations (Other) - miscellaneous violations, such as failure to issue annual consumer confidence reports or maintain required records.
SDWA Table Key
| Field | Description |
|---|---|
| Compliance Period | Dates of the compliance period. |
| Status |
Current status of the violation.
|
| Health-Based? | Whether the violation is health based. |
| Category Code |
The category of violation that is reported.
|
| Code | A full description of violation codes can be accessed in the SDWA_REF_CODE_VALUES (CSV) table. |
| Contaminant Code | A code value that represents a contaminant for which a public water system has incurred a violation of a primary drinking water regulation. |
| Rule Code |
Code for a National Drinking Water rule.
|
| Rule Group Code |
Code that uniquely identifies a rule group.
|
| Rule Family Code |
Code for rule family.
|
For more clarification please visit the EPA's data dictionary.
Redlands Water - Frequently Asked Questions
| By Phone: | 909-798-7658 |
| By Email: | jharris@cityofredlands.org |
| By Mail: | P.O. Box 3005 REDLANDS, CA, 92373 |
Existing customers can login to their Redlands City Mud-Water Div account to pay their Redlands water bill by clicking here.
If you want to pay your Redlands City Mud-Water Div bill online and haven't made an account yet, you can create an account online. Please click here to create your account to pay your Redlands water bill.
If you don't want to make an account, or can't remember your account, you can make a one-time payment towards your Redlands water bill without creating an account using a one time payment portal with your account number and credit or debit card. Click here to make a one time payment.
Moving to a new house or apartment in Redlands means you will often need to put the water in your name with Redlands City Mud-Water Div. In order to put the water in your name, please click the link to the start service form below. Start service requests for water bills typically take two business days.
Leaving your house or apartment in Redlands means you will likely need to take your name off of the water bill with Redlands City Mud-Water Div. In order to take your name off the water bill, please click the link to the stop service form below. Stop service for water bills requests typically take two business days.
The estimated price of bottled water
$2 in USD (1.5-liter)
USER SUBMITTED RATINGS
- Drinking Water Pollution and Inaccessibility
- Water Pollution
- Drinking Water Quality and Accessibility
- Water Quality
The above data is comprised of subjective, user submitted opinions about the water quality and pollution in Redlands, measured on a scale from 0% (lowest) to 100% (highest).
Related FAQS
Redlands Water Quality Report (Consumer Confidence Report)
The EPA mandates that towns and cities consistently monitor and test their tap water. They must report their findings in an annual Consumer Confidence Report. Below is the most recent water quality report from Redlands's Water. If you would like to see the original version of the report, please click here.
2021
CITY OF REDLANDS
CONSUMER CONFIDENCE REPORT

. |
|
. |
|
. |
This page intentionally blank. |
Last year, as in years past, your tap water exceeded all U.S. EPA and State drinking water health standards. The City of Redlands vigilantly safeguards its water supplies and once again, we are proud to report that our system has never violated a maximum contaminant level or any other water quality standard. This brochure is a snapshot of last year’s water quality. Included are details about where your water comes from, what it contains, and how it compares to State standards. We are
committed to providing you with information because informed customers are our best allies.
WATER SOURCE PROTECTION
The City of Redlands is committed to protecting our water sources from possible contamination. Source water assessments were completed in 2002 for all of our drinking water supplies. You can view the source water assessments at our office (location listed on back page). The assessments help to identify the vulnerability of drinking water supplies. These assessments are intended to provide basic information necessary for us to develop programs to protect our drinking water supplies. Possible contaminants can originate from: agricultural drainage, urban runoff, septic systems, sewer collection systems, junk/scrap/salvage operations, crop irrigation, underground storage tanks at automobile gas stations and illegal dumping.
Anyone interested in receiving a copy of the source water assessment should contact the City’s water system contact:
Kevin Watson, Utilities Operations Manager (909)
IMPORTANT FACTS FROM THE U.S. EPA
ABOUT DRINKING WATER
The sources of drinking water (both tap water and bottled water) include rivers, lakes, streams, ponds, reservoirs, springs, and wells. As water travels over the surface of the land or through the ground, it dissolves naturally- occurring minerals and, in some cases, radioactive material, and can pick up contaminants from the presence of animals or from human activity.
Contaminants that may be present in source water include:
- Microbial contaminants, such as viruses and bacteria, that may come from sewage treatment plants, septic systems, agricultural livestock operations, and wildlife.
-
Inorganic contaminants, such as salts and metals, that can be
naturally-occurring or result from urban stormwater runoff, industrial or domestic wastewater discharges, oil and gas production, mining, or farming. - Pesticides and herbicides, that may come from a variety of sources such as agriculture, urban stormwater runoff, and residential uses.
- Organic chemical contaminants, including synthetic and volatile organic chemicals, that are byproducts of industrial processes and petroleum production, and can also come from gas stations, urban stormwater runoff, agricultural application, and septic systems.
-
Radioactive contaminants, that can be
naturally-occurring or be the result of oil and gas production and mining activities.
In order to ensure that tap water is safe to drink, the U.S. Environmental Protection Agency (U.S. EPA) and the State Water Resources Control Board (State Water Board) prescribe regulations that limit the amount of certain contaminants in water provided by public water systems. State Water Board regulations also establish limits for contaminants in bottled water that provide the same protection for public health.
SOURCES OF WATER
The City of Redlands was incorporated in 1888 and has developed extensively from its origin as an agricultural area. More than 75,000
residents in Redlands, Mentone, parts of Crafton Hills and San Timoteo Canyon, and small parts of Loma Linda and San Bernardino depend on the Redlands Municipal Utilities & Engineering Department to provide water service to their homes and businesses.
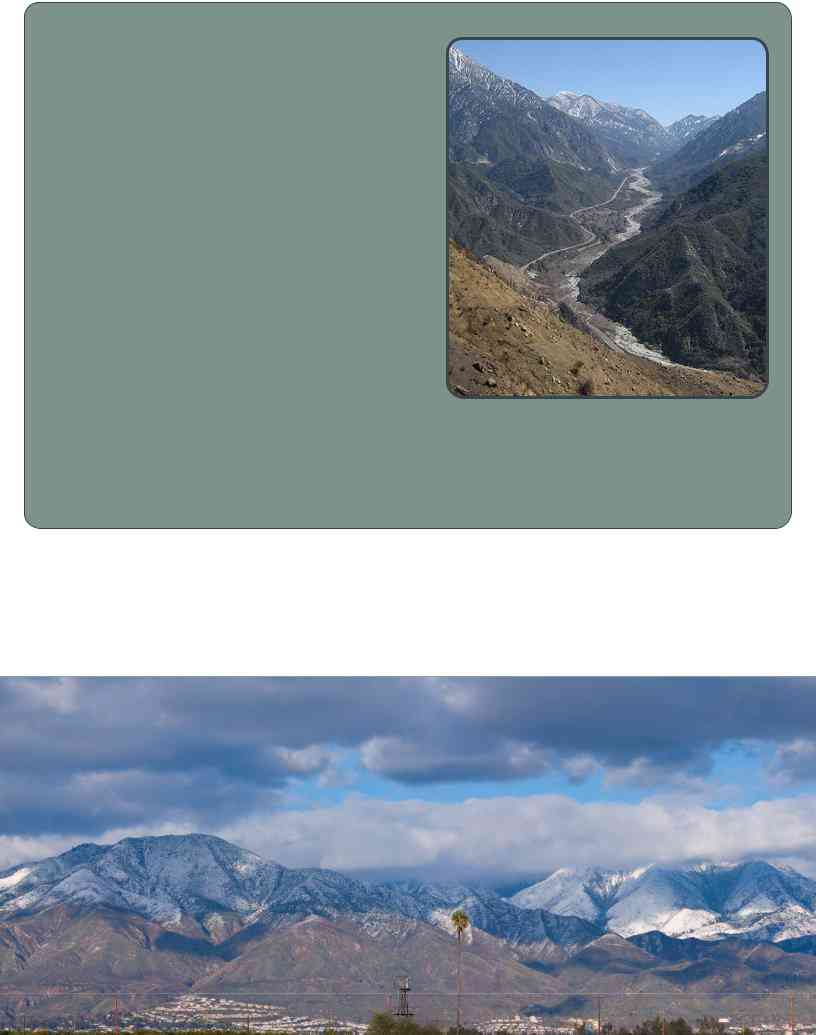
The City of Redlands water system is supported by groundwater and surface water sources. Surface water sources include the Santa Ana River Watershed, Mill Creek Watershed and California State Water Project. Approximately 50% of the of the drinking water produced is treated surface water delivered by the Horace P. Hinckley and Henry Tate conventional surface water treatment plants. The remaining 50% is produced by 23 local groundwater wells located
within the Bunker Hill Groundwater Basin.
Pictured: Mill Creek, looking northeast from Morton Peak. Mill Creek provides approximately 25% of the CIty’s water supply.
Drinking water, including bottled water, may reasonably be expected to contain at least small amounts of some contaminants. The presence of contaminants does not necessarily indicate that water poses a health risk. More information about contaminants and potential health effects can be obtained by calling the U.S. EPA’s Safe Drinking Water Hotline
The U.S. Food and Drug Administration regulations and California law also establish limits for contaminants in bottled water that provide the same protection for public health. Additional information on bottled water is available on California Department of Public Health’s website at https://www.cdph.ca.gov/Programs/CEH/ DFDCS/Pages/FDBPrograms/FoodSafetyProgram/Water.aspx
Some people may be more vulnerable to contaminants in drinking water than the general population.
For information on ground water and drinking water, please visit:

TERMS USED IN THIS REPORT
MAXIMUM CONTAMINANT LEVEL (MCL):
The highest level of a contaminant that is allowed in drinking water. Primary MCLs are set as close to the PHGs (or MCLGs) as is economically and technologically feasible. Secondary MCLs are set to protect the odor, taste, and appearance of drinking water.
MAXIMUM CONTAMINANT LEVEL GOAL (MCLG):
The level of a contaminant in drinking water below which there is no known or expected risk to health. MCLGs are set by the US Environmental Protection Agency (US EPA).
MAXIMUM RESIDUAL DISINFECTANT LEVEL (MRDL):
The highest level of a disinfectant allowed in drinking water. There is convincing evidence that the addition of a disinfectant is necessary for control of microbial contaminants.
MAXIMUM RESIDUAL DISINFECTANT LEVEL GOAL (MRDLG):
The level of a drinking water disinfectant below which there is no known or expected risk to health. MRDLG’s do not reflect the benefits of the use of disinfectants to control microbial contaminants.
N/A:
Not applicable
ND:
Not detectable at testing limit.
NS:
No standards
NT:
Not tested
PUBLIC HEALTH GOAL (PHG):
The level of a contaminant in drinking water below which there is no known or expected risk to health. PHGs are set by the California Environmental Protection Agency.
PRIMARY DRINKING WATER STANDARDS (PDWS):
MCLs and MRDLs for contaminants that affect health, along with their monitoring, reporting and water treatment requirements.
REGULATORY ACTION LEVELS (AL):
The concentration of a contaminant which, if exceeded, triggers treatment or other requirements that water system must follow.
NEPHELOMETRIC TURBIDITY UNIT (NTU):
Nephelometric Turbidity Unit is a measure of the clarity of water. Turbidity in excess of 5 NTU is just noticeable to the average person.
TREATMENT TECHNIQUE (TT):
A required process intended to reduce the level of a contaminant in drinking water.
IMPORTANT INFORMATION
This report contains important information about your drinking water. Please contact the City of Redlands at 35 Cajon Street, Suite 15A, Redlands CA 92373 or
Este informe contiene información muy importante sobre su agua para beber. Favor de comunicarse City of Redlands a
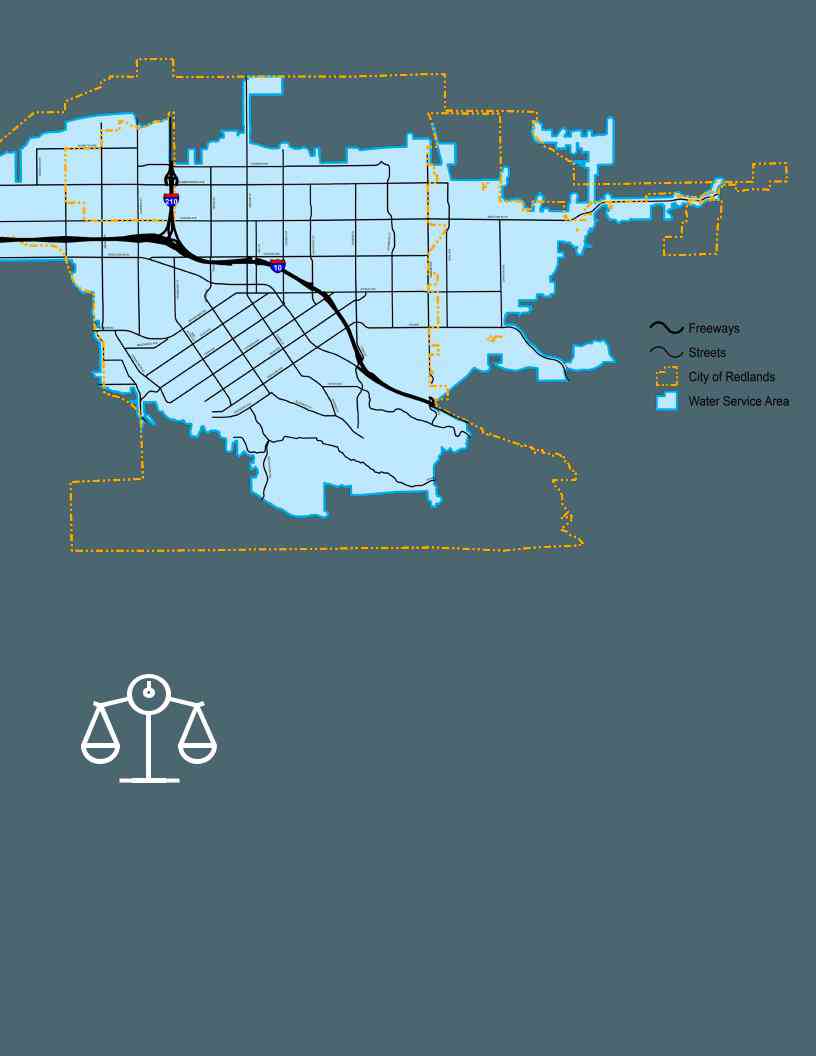
CITY OF REDLANDS WATER SERVICE AREA
UNITS OF MEASURE
Parts per million (ppm) or milligrams per liter (mg/L).
Parts per billion (ppb) or Micrograms per liter (µg/L).
Parts per Trillion (ppt) or nanograms per liter (ng/L).
Picocuries per liter (pCi/L): a measurement of the radioactivity in water.
Umhos/cm: A measure of conductivity in water.
UNITS: A COMPARISON TO TIME
mg/L (milligrams per liter) OR ppm (parts per million) = 1 second in 11.5 days
µg/L (micrograms per liter) OR ppb (parts per billion) = 1 second in nearly 32 years ng/L (nanograms per liter) OR ppt (parts per trillion) = 1 second in nearly 32,000 years
pg/L (picograms per liter) OR ppq (parts per quadrillion) = 1 second in nearly 32,000,000 years
MICROBIOLOGICAL CONTAMINANTS
SAMPLING YEAR: 2020 |
|
|
|
|
|
||
|
|
|
|
|
|
|
|
|
|
|
|
SURFACE |
|
MAJOR |
|
CONTAMINANT |
TRADITIONAL MCL |
PHG |
DISTRIBUTION |
WATER |
VIOLATION |
SOURCES IN |
|
(CCR UNITS) |
SUPPLY |
SUPPLY |
DRINKING |
||||
|
|
|
|||||
|
|
|
|
(TREATED) |
|
WATER |
|
Total Coliform |
MCL: Systems that |
0 |
1% |
ND |
No |
Naturally |
|
Bacteria |
collect ≥40 samples/ |
|
|
|
|
present |
|
(state Total |
month: 5.0% of monthly |
|
|
|
|
in the |
|
Coliform Rule) |
samples are positive; |
|
|
|
|
environment |
|
|
Systems that collect |
|
|
|
|
|
|
|
<40 samples/month: 1 |
|
|
|
|
|
|
|
positive monthly sample |
|
|
|
|
|
|
Total Coliform |
TT |
N/A |
1% |
ND |
No |
Naturally |
|
Bacteria |
|
|
|
|
|
present |
|
(federal Revised |
|
|
|
|
|
in the |
|
Total Coliform |
|
|
|
|
|
environment |
|
Rule) |
|
|
|
|
|
|
|
Turbidity [1] |
TT |
N/A |
0.19 (average) |
".03 |
No |
Soil runoff |
|
|
|
|
|
(average)" |
|
|
|
|
|
|
|
|
|
|
|
[1] Turbidity is a measure of the cloudiness of the water. We monitor it because it is a good indicator of water |
|
||||||
quality. High turbidity can hinder the effectiveness of disinfectants. |
|
|
|
||||
|
|
|
|
|
|
|
|
CONVENTIONAL SURFACE WATER TREATMENT PLANT FILTER PERFORMANCE
CONTAMINANT |
MCL |
PHG |
LEVEL |
RANGE |
SAMPLE DATE |
VIOLATION |
TYPICAL |
|
FOUND |
SOURCE |
|||||||
|
|
|
|
|
|
|||
Turbidity |
TT = 1 NTU |
N/A |
0.25 NTU |
.03 |
2020 |
No |
Soil runoff |
|
|
TT = 95% of |
|
100% |
.03 |
|
|
|
|
|
samples ≤0.3 |
|
|
|
|
|
|
|
|
NTU |
|
|
|
|
|
|
Turbidity is a measure of the cloudiness of the water. We monitor it because it is a good indicator of the effectiveness of our filtration system.
ABBREVIATIONS
KEY
AL = Regulatory Action Level
MCL = Maximum Contaminant Level
MCLG = Maximum Contaminant Level Goal
MRDL = Maximum Residual Disinfectant Level
MRDLG = Maximum Residual Disinfectant Level Goal
PHG = Public Health Goal
-
= Treatment Technique
MFL = million fibers per liter
HEALTH EFFECTS LANGUAGE
Coliforms are bacteria that are naturally present in the environment and are used as an indicator that other,
Coliforms are bacteria that are naturally present in the environment and are used as an indicator that other, potentially harmful, waterborne pathogens may be present or that a potential pathway exists through which contamination may enter the drinking water distribution system. We found coliforms indicating the need to look for potential problems in water treatment or distribution. When this occurs, we are required to conduct assessment(s) to identify problems and to correct any problems that were found during these assessments.
Turbidity has no health effects. However, high levels of turbidity can interfere with disinfection and provide a medium for microbial growth. Turbidity may indicate the presence of
This Consumer Confidence Report (CCR) reflects changes in drinking water
regulatory requirements during 2016. All water systems are required to comply with the state Total Coliform Rule. Effective April 1, 2016, all water systems are also required to comply with the federal Revised Total Coliform Rule. The new federal rule maintains the purpose to protect public health by ensuring the integrity of the drinking water distribution system and monitoring for the presence of microbials (i.e., total coliform and E. coli bacteria). The U.S. EPA anticipates greater public health protection as the new rule requires water systems that
are vulnerable to microbial contamination to identify and fix problems. Water systems that exceed a specified frequency of total coliform occurrences are
required to conduct an assessment to determine if any sanitary defects exist. If found, these must be corrected by the water system.
NTU = Nephelometric Turbidity Units
N/A = not applicable
pCi/L = picocuries per liter (a measure of radioactivity)
mrem/year = millirems per year (a measure of radiation absorbed by the body)
ppm = parts per million, or milligrams per liter (mg/L)
ppb = parts per billion, or micrograms per liter (µg/L)
ppt = parts per trillion, or nanograms per liter (ng/L)
ppq = parts per quadrillion, or picograms per liter (pg/L)
INORGANIC CONTAMINANTS
|
|
MCL IN |
PHG |
GROUNDWATER |
GROUNDWATER |
SURFACE |
SURFACE |
|
CONTAMINANT |
|
WATER |
WATER |
|||||
YEAR |
CCR |
(MCLG) IN |
SUPPLY |
SUPPLY |
||||
(CCR UNITS) |
SUPPLY |
SUPPLY |
||||||
|
UNITS |
CCR UNITS |
AVERAGE |
RANGE |
||||
|
|
AVERAGE |
RANGE |
|||||
|
|
|
|
|
|
|||
Aluminum (mg/L) |
2019 |
1 |
0.6 |
0.01 |
.02 |
ND |
ND |
|
Barium (mg/L) |
2019 |
1 |
2 |
0.02 |
.01 |
0.02 |
.01 |
|
Chromium |
2019 |
50 |
(100) |
1.5 |
ND - 7.1 |
0.32 |
ND |
|
[Total] (µg/L) |
|
|
|
|
|
|
|
|
Fluoride |
2020 |
2 |
1 |
0.6 |
.3 - 1.6 |
0.5 |
.2 |
|
(naturally occurring) |
|
|
|
|
|
|
|
|
(mg/L) |
|
|
|
|
|
|
|
|
Nickel (µg/L) |
2019 |
100 |
12 |
2.3 |
2.0 - 2.5 |
ND |
ND |
|
Nitrate (mg/L) |
2020 |
"10 |
"10 |
3.1 |
ND |
ND |
||
|
|
(as N)" |
(as N)" |
|
|
|
|
|
Perchlorate (µg/L) |
2020 |
6 |
1 |
ND |
ND - 4.7 |
ND |
ND |
|
|
|
|
|
|
|
|
|
No violations occurred as a result of these contaminant testings in 2019 and 2020.
PUBLIC PARTICIPATION OPPORTUNITIES
City Council meetings are held on the first and third Tuesdays of every month and the Municipal Utilities /Public Works Commission (MUPWC) meetings are held the first Monday of even numbered months. All items that are heard by the City Council or the MUPWC are placed on the required agendas and posted at City Hall located at 35 Cajon Street, Redlands, California.

PLEASE NOTE:
THE STATE ALLOWS US TO MONITOR FOR SOME CONTAMINANTS LESS THAN ONCE PER YEAR BECAUSE THE CONCENTRATIONS OF THESE CONTAMINANTS DO NOT CHANGE FREQUENTLY. SOME OF OUR DATA, THOUGH REPRESENTATIVE, ARE MORE THAN ONE YEAR OLD.
MAJOR SOURCES IN |
HEALTH EFFECTS LANGUAGE |
|
DRINKING WATER |
||
|
||
Erosion of natural deposits; residue from some |
Some people who drink water containing aluminum in excess |
|
surface water treatment processes |
of the MCL over many years may experience |
|
|
gastrointestinal tract effects. |
|
Discharges of oil drilling wastes and from metal |
Some people who drink water containing barium in excess |
|
refineries; erosion of natural deposits |
of the MCL over many years may experience an increase in |
|
|
blood pressure. |
|
Discharge from steel and pulp mills and chrome |
Some people who use water containing chromium in excess of |
|
plating; erosion of natural deposits |
the MCL over many years may experience allergic dermatitis. |
|
Erosion of natural deposits; water additive that |
Some people who drink water containing fluoride in excess |
|
promotes strong teeth; discharge from fertilizer |
of the federal MCL of 4 mg/L over many years may get bone |
|
and aluminum factories |
disease, including pain and tenderness of the bones. Children |
|
|
who drink water containing fluoride in excess of the state MCL |
|
|
of 2 mg/L may get mottled teeth. |
|
Erosion of natural deposits; discharge from |
Some people who drink water containing nickel in excess of |
|
metal factories |
the MCL over many years may experience liver and heart |
|
|
effects. |
|
Runoff and leaching from fertilizer use; leaching |
Infants below the age of six months who drink water containing |
|
from septic tanks and sewage; erosion of |
nitrate in excess of the MCL may quickly become seriously ill |
|
natural deposits |
and, if untreated, may die because high nitrate levels can |
|
|
interfere with the capacity of the infant’s blood to carry |
|
|
oxygen. Symptoms include shortness of breath and blueness |
|
|
of the skin. High nitrate levels may also affect the oxygen- |
|
|
carrying ability of the blood of pregnant women. |
|
Perchlorate is an inorganic chemical used in sol- |
Perchlorate has been shown to interfere with uptake of iodide |
|
id rocket propellant, fireworks, explosives, flares, |
by the thyroid gland, and to thereby reduce the production of |
|
matches, and a variety of industries. It usually |
thyroid hormones, leading to adverse effects associated with |
|
gets into drinking water as a result of environ- |
inadequate hormone levels. Thyroid hormones are needed |
|
mental contamination from historic aerospace |
for normal prenatal growth and development of the fetus, as |
|
or other industrial operations that used or use, |
well as for normal growth and development in the infant and |
|
store, or dispose of perchlorate and its salts. |
child. In adults, thyroid hormones are needed for normal me- |
|
|
tabolism and mental function. |
A NOTE ABOUT NITRATE
|
Nitrate in drinking water at levels above 10 mg/L is a health risk for |
NO3 |
infants of less than six months of age. Such nitrate levels in drinking |
water can interfere with the capacity of the infant’s blood to carry |
|
oxygen, resulting in a serious illness; symptoms include shortness of |
|
breath and blueness of the skin. Nitrate levels above 10 mg/L may |
|
also affect the ability of the blood to carry oxygen in other individuals, |
|
|
such as pregnant women and those with certain specific enzyme |
|
deficiencies. If you are caring for an infant, or you are pregnant, you |
|
should ask advice from your health care provider. |
REGULATED CONTAMINANTS WITH SECONDARY DRINKING WATER STANDARDS
Monitoring required by section 64449 of the California Code of Regulations, Title 22.
CONSTITUENT |
YEAR |
SECONDARY |
GROUNDWATER |
GROUNDWATER |
SURFACE WATER SUPPLY |
|
MCL (UNITS) |
SUPPLY |
RANGE |
(TREATED) |
|||
|
|
|||||
Aluminum |
2019 |
0.2 mg/L |
11 |
ND - 130 |
ND |
|
Foaming Agents |
2019 |
0.5 mg/L |
0.01 |
ND |
0.04 |
|
[MBAS] |
||||||
|
|
|
|
|
||
Iron |
2019 |
0.3 mg/L |
0.03 |
ND |
0.01 |
|
Turbidity |
2020 |
5 Units |
0.4 |
.1 - 1.6 |
0.03 |
|
Total Dissolved Solids |
2020 |
1,000 mg/L |
237 |
180 - 400 |
230 |
|
[TDS] |
||||||
|
|
|
|
|
||
Specific Conductance |
2020 |
1,600 µS/cm |
396 |
280 - 660 |
375 |
|
Chloride |
2020 |
500 mg/L |
19 |
5 - 55 |
27 |
|
Sulfate |
2020 |
500 mg/L |
18 |
18 - 75 |
36 |
NOTE: There are no PHGs, MCLGs, or mandatory standard health effects language for these constituents because secondary MCLs are set on the basis of aesthetic concerns.
SODIUM(mg/L)*
2020
GROUNDWATER
Supply: 25
Range:
SURFACE WATER SUPPLY (TREATED)
Supply: 27
Range:
“Sodium” refers to the salt present in the water and is
Generally naturally occurring.
HARDNESS(mg/L)*
2020
GROUNDWATER
Supply: 146
Range:
SURFACE WATER SUPPLY (TREATED)
Supply: 133
Range:
“Hardness” is the sum of polyvalent cations present in the water, generally magnesium and calcium. The cations are usually naturally occurring.
*Sodium and Hardness do not have a Maximum Contaminant Level, Public Health Goal
SURFACE WATER |
|
|
SUPPLY (TREATED) |
TYPICAL SOURCE OF CONTAMINANT |
|
RANGE |
|
|
ND |
Erosion of natural deposits; residual from some surface water treatment processes |
|
0.04 |
Municipal and industrial waste discharges |
|
.01 |
Leaching from natural deposits; industrial wastes |
|
.03 |
Soil runoff |
|
230 |
- 230 |
Runoff/leaching from natural deposits |
360 |
- 390 |
Substances that form ions when in water; seawater influence |
6 - 47 |
Runoff/leaching from natural deposits; seawater influence |
|
33 |
- 39 |
Runoff/leaching from natural deposits; industrial wastes |
HELP US PROTECT OUR WATER SOURCES!
Protection of drinking water is everyone’s responsibility. You can help protect your community’s drinking water source in several ways:
- Eliminate excess use of lawn and garden fertilizers and pesticides – they contain hazardous chemicals that can reach your drinking water source.
- Pick up after your pets.
- If you have your own septic system, properly maintain your system to reduce leaching to water sources or consider connecting to a public water system.
- Dispose of chemicals properly; take used motor oil to a recycling center.
UCMR 4
SAMPLING YEAR: 2019
CYANOTOXINS |
MINIMUM |
SYSTEM |
SYSTEM |
TYPICAL SOURCE OF |
|
REPORTING LEVEL |
AVERAGE |
RANGE |
CONTAMINANT |
Manganese |
0.4 µg/L |
0.41 |
ND - 1.5 |
Leaching from natural deposits |
Total Organic |
Carbon N/A |
1 |
0 - 3.7 |
Various natural and manmade |
(TOC) * |
|
|
|
sources |
Bromide *
N/A
0.02
ND - 1.1
N/A
* Raw surface water sources
Unregulated contaminant monitoring helps U.S. EPA and the State Water Resources Control Board to determine where certain contaminants occur and whether the contaminants need to be regulated.
DISINFECTION BYPRODUCTS, DISINFECTANT RESIDUALS, AND PRECURSORS
SAMPLING YEAR: 2020 |
|
|
|
|
|
|
CONTAMINANT (CCR |
MCL OR |
PHG, |
DISTRIBUTION |
DISTRIBUTION |
MAJOR SOURCES |
|
[MRDL] IN |
(MCLG) OR |
SYSTEM |
SYSTEM |
IN DRINKING |
||
UNITS) |
||||||
CCR UNITS |
[MRDLG] |
AVERAGE |
RANGE |
WATER |
||
|
||||||
TTHMs [Total |
|
|
|
|
Byproduct of |
|
80 |
N/A |
31 |
ND - 70 |
drinking water |
||
Trihalomethanes] (µg/L) |
||||||
|
|
|
|
disinfection |
||
|
|
|
|
|
||
HAA5 [Sum of 5 |
|
|
|
|
Byproduct of |
|
60 |
N/A |
23 |
ND - 47 |
drinking water |
||
Haloacetic Acids] (µg/L) |
||||||
|
|
|
|
disinfection |
||
|
|
|
|
|
||
|
|
|
|
|
Drinking water |
|
Chlorine (mg/L) |
[MRDL = 4.0 [MRDLG = 4 (as |
0.9 |
.3 - 1.7 |
disinfectant |
||
(as Cl2)] |
Cl2)] |
added for |
||||
|
|
|
||||
|
|
|
|
|
treatment |
|
Control of DBP Precursors |
|
|
|
|
Various natural |
|
TT |
N/A |
1.1 |
.5 - 2.3 |
and manmade |
||
(TOC) |
||||||
|
|
|
|
sources |
||
|
|
|
|
|
There were no violations in 2020 for the above listed contaminants.
HEALTH EFFECTS LANGUAGE
Manganese exposures resulted in neurological effects. High levels of manganese in people have been shown to result in adverse effects to the nervous system.
Total organic carbon (TOC) has no health effects. Howev- er, TOC provides a medium for the formation of disinfec- tion byproducts. These byproducts include trihalometh- anes (THMs) and haloacetic acids (HAAs). Drinking water containing these byproducts in excess of the MCL may lead to adverse health effects, liver, or kidney problems, or nervous system effects, and may lead to an increased risk of getting cancer.
N/A
BACKGROUND
The 1996 Amendments to the SDWA required the U.S. EPA to establish criteria for a monitoring program for unregulated contaminants, and to publish, once every five years, a list of no more than 30 contaminants to be monitored by public water systems (PWS).
Section 64450 of the California Code of Regulations also required certain water systems to monitor a number of unregulated contaminants, with contaminant lists that were published or revised in 1990, 1996, 2000, and 2003. This section of the California Code of Regulations was repealed effective October 18, 2007. Water systems that continued to monitor for state unregulated contaminants are encouraged, but not required, to include the information regarding detected contaminants in the CCR.
Although Section 64450 of the California Code of Regulations was repealed, the State Water Board may request water systems to monitor for specific contaminants per HSC section 116375(b).
DISINFECTION BYPRODUCT
HEALTH EFFECTS LANGUAGE
Some people who drink water containing trihalomethanes in excess of the MCL over many years may experience liver, kidney, or central nervous system problems, and may have an increased risk of getting cancer.
Some people who drink water containing haloacetic acids in excess of the MCL over many years may have an increased risk of getting cancer.
Some people who use water containing chlorine well in excess of the MRDL could experience irritating effects to their eyes and nose. Some people who drink water containing chlorine well in excess of the MRDL could experience stomach discomfort.
Total organic carbon (TOC) has no health effects. However, total organic carbon provides a medium for the formation of disinfection byproducts. These byproducts include trihalomethanes (THMs) and haloacetic acids (HAAs). Drinking water containing these byproducts in excess of the MCL may lead to adverse health effects, liver or kidney problems, or nervous system effects, and may lead to an increased risk of cancer.
LEAD & COPPER
SAMPLE DATE: 2020
CONTAMINANT |
MCL |
PHG |
AVERAGE |
RANGE |
NUMBER OF SCHOOLS |
|
REQUESTING LEAD SAMPLING |
||||||
|
|
|
|
|
||
Lead (µg/L) |
AL = 15 |
0.2 |
ND |
34 sites sampled; 0 sites over AL |
0 |
|
Copper (mg/L) |
AL = |
0.3 |
ND |
34 sites sampled; 0 sites over AL |
N/A |
|
1.3 |
||||||
|
|
|
|
|
||
|
|
|
|
|
|
There were no violations in 2020 for the above listed contaminants.
RADIOACTIVE CONTAMINANTS
SAMPLE DATE: 2019
|
MCL IN |
|
GROUNDWATER |
GROUNDWATER |
SURFACE |
SURFACE |
MAJOR SOURCES |
|
CONTAMINANT |
|
WATER |
WATER |
|||||
CCR |
PHG |
SUPPLY |
SUPPLY |
IN DRINKING |
||||
(CCR UNITS) |
SUPPLY |
SUPPLY |
||||||
UNITS |
|
AVERAGE |
RANGE |
WATER |
||||
|
|
AVERAGE |
RANGE |
|||||
|
|
|
|
|
|
|||
Gross Beta |
|
|
|
|
|
1.49 - |
Decay of natural |
|
Particle Activity |
50 [1] |
0 |
4.8 |
1.05 - 13.3 |
1.54 |
and |
||
1.58 |
||||||||
(pCi/L) |
|
|
|
|
|
deposits |
||
|
|
|
|
|
|
|||
|
|
|
|
|
|
|
|
|
|
|
|
|
|
|
Decay of natural |
||
8 |
0.35 |
0.56 |
ND - 2.1 |
0.34 |
.2 |
and |
||
(pCi/L) |
||||||||
|
|
|
|
|
|
deposits |
||
|
|
|
|
|
|
|
||
Gross Alpha |
|
|
|
|
|
|
Erosion of natural |
|
Particle Activity |
15 |
0 |
7 |
3 - 15 |
2 |
0 - 4 |
||
deposits |
||||||||
(pCi/L) |
|
|
|
|
|
|
||
|
|
|
|
|
|
|
||
|
|
|
|
|
|
|
|
|
Combined |
5 |
(0) |
0.06 |
.04 |
ND |
ND |
Erosion of natural |
|
Radium (pCi/L) |
[2] |
deposits |
||||||
|
|
|
|
|
||||
|
|
|
|
|
|
|
|
|
Uranium (pCi/L) |
20 |
0.43 |
3 |
ND - 12 |
0.4 |
ND - 1 |
Erosion of natural |
|
deposits |
||||||||
|
|
|
|
|
|
|
||
|
|
|
|
|
|
|
|
- Effective June 11, 2006, the gross beta particle activity MCL is 4 millirem/year annual dose equivalent to the total body or any internal organ. 50 pCi/L is used as a screening level.
-
If reporting results for
Ra-226 andRa-228 as individual constituents, the PHG is 0.05 pCi/L forRa-226 and 0.019 pCi/L forRa-228. “The State Water Resources Control Board considers 50 pCi/L to be the level of concern for beta particles.”
There were no violations in 2019 for the above listed contaminants.

TYPICAL SOURCE
Internal corrosion of household water plumbing systems; discharges from industrial manufacturers; erosion of natural deposits
Internal corrosion of household plumbing systems; erosion of natural deposits; leaching from wood preservatives
HEALTH EFFECTS LANGUAGE
Certain minerals are radioactive and may emit forms of radiation known as photons and beta radiation. Some people who drink water containing beta and photon emitters in excess of the MCL over many years may have an increased risk of getting cancer.
Some people who drink water containing
of the MCL over many years may have an increased risk of
getting cancer.
Certain minerals are radioactive and may emit a form of radiation known as alpha radiation. Some people who drink water containing alpha emitters in excess of the MCL over many years may have an increased risk of getting cancer.
Some people who drink water containing radium 226 or 228 in excess of the MCL over many years may have an increased risk of getting cancer.
Some people who drink water containing uranium in excess of the MCL over many years may have kidney problems or an increased risk of getting cancer.
82
Pb
Lead
If present, elevated levels of lead can cause serious health problems, especially for pregnant women and young children. Lead in drinking water is primarily from materials and components associated with service lines and home plumbing. The City of Redlands is responsible for providing high quality drinking water, but cannot control the variety of materials used in plumbing components. When your water has been sitting for several hours, you can minimize the potential for lead exposure by flushing your tap for 30 seconds to 2 minutes before using water for drinking or cooking. If you are concerned about lead in your water, you may wish to have your water tested. Information on lead in drinking water, testing methods, and steps you can take to minimize exposure is available from the Safe Drinking Water Hotline or at http://www.epa.gov/lead.

CONTACT US
CITY OF REDLANDS, MUNICIPAL UTILITIES & ENGINEERING DEPARTMENT P.O. BOX 3005 35 CAJON STREET, SUITE 15A
REDLANDS, CA 92373
CITYOFREDLANDS.ORG/MUED
PO BOX 3005
Redlands, CA 92373
POSTAL CUSTOMER
Contaminants
Redlands City
EWG's drinking water quality report shows results of tests conducted by the water utility and provided to the Environmental Working Group by the California State Water Resources Control Board, as well as information from the U.S. EPA Enforcement and Compliance History database (ECHO). For the latest quarter assessed by the U.S. EPA (January 2019 - March 2019), tap water provided by this water utility was in compliance with federal health-based drinking water standards.
Utility details
- Serves: 80000
- Data available: 2012-2017
- Data Source: Surface water
- Total: 28
Contaminants That Exceed Guidelines
- Bromodichloromethane
- Bromoform
- Chloroform
- Chromium (hexavalent)
- Dibromochloromethane
- Dichloroacetic acid
- Nitrate
- Nitrate and nitrite
- Radium%2C combined (-226 & -228)
- Radon
- Total trihalomethanes (TTHMs)
- Trichloroacetic acid
- Uranium
Other Detected Contaminants
- 1%2C2-Dibromo-3-chloropropane (DBCP)
- Aluminum
- Bromochloroacetic acid
- Chlorate
- Chromium (total)
- Dibromoacetic acid
- Fluoride
- Haloacetic acids (HAA5)
- Manganese
- Molybdenum
- Monobromoacetic acid
- Monochloroacetic acid
- Perchlorate
- Strontium
- Vanadium
Reminder
Always take extra precautions, the water may be safe to drink when it leaves the sewage treatment plant but it may pick up pollutants during its way to your tap. We advise that you ask locals or hotel staff about the water quality. Also, note that different cities have different water mineral contents.
Sources and Resources
Sources Cited
Additional Resources
‘
The Environmental Protection Agency has determined that there are two main sources of contamination in the City of Redlands, CA. They are runoff from the Los Angeles River and from wastewater. Although each of these sources can be treated separately and both should be cleaned by a professional company, the combination of these two pollutants is what causes the most health risks to those who live there.
The main source of contamination from the Los Angeles River is from industrial runoff, since the majority of this water comes from factories that are located on or near the river. The waste water that has accumulated on the riverbanks since the beginning of time also has traces of industrial waste and toxins.
The major concern about the Los Angeles River is that it carries a heavy amount of industrial waste. In fact, it carries so much waste that it has become a major problem for the fish in the Redlands River, which is used as the primary drinking wate