Table of Contents
Can You Drink Tap Water in Huntington Beach?
Yes, Huntington Beach's tap water is generally considered safe to drink as Huntington Beach has no active health based violations of the Safe Drinking Water Act (SDWA) that we are aware of. Other factors such as lead piping in a home, or low levels of pollutants on immunocompromised individuals, should also be considered, however. To find more recent info we might have, you can check out our boil water notice page or the city's water provider website.
According the EPA’s ECHO database, from April 30, 2019 to June 30, 2022, Huntington Beach's water utility, City of Huntington Beach, had 0 violations of the Safe Drinking Water Act. For more details on the violations, please see our violation history section below. This assessment is based on the City of Huntington Beach water system, other water systems in the city may have different results.
While tap water that meets the EPA health guidelines generally won’t make you sick to your stomach, it can still contain regulated and unregulated contaminants present in trace amounts that could potentially cause health issues over the long-run. These trace contaminants may also impact immunocompromised and vulnerable individuals.
The EPA is reviewing if it’s current regulations around pollutant levels in tap water are strict enough, and the health dangers posed by unregulated pollutants, like PFAS.
Water Quality Report for Huntington Beach Tap Water
The most recent publicly available numbers for measured contaminant levels in Huntington Beach tap water are in its 2020 Water Quality Report. As you can see, there are levels which the EPA considers to be acceptable, but being below the maximum allowable level doesn’t necessarily mean the water is healthy.
Lead in tap water, for example, is currently allowed at up to 15ppb by the EPA, but it has set the ideal goal for lead at zero. This highlights how meeting EPA standards doesn’t necessarily mean local tap water is healthy.
EPA regulations continue to change as it evaluates the long term impacts of chemicals and updates drinking water acceptable levels. The rules around arsenic, as well as, lead and copper are currently being re-evaluated.
There are also a number of "emerging" contaminants that are not currently. For example, PFAS (Per- and polyfluoroalkyl substances), for which the EPA has issued a health advisory. PFAS are called "forever chemicals" since they tend not to break down in the environment or the human body and can accumulate over time.
We recommend looking at the contaminants present in Huntington Beach's water quality reports, or getting your home's tap water tested to see if you should be filtering your water.
Huntington Beach Tap Water Safe Drinking Water Act Violation History - Prior 10 Years
Below is a ten year history of violations for the water system named City of Huntington Beach for Huntington Beach in California. For more details please see the "What do these Violations Mean?" section below.
Is there Lead in Huntington Beach Water?
Based on the EPA’s ECHO Database, 90% of the samples taken from the Huntington Beach water system, City of Huntington Beach, between sample start date and sample end date, were at or below, 0.007 mg/L of lead in Huntington Beach water. This is 46.7% of the 0.015 mg/L action level. This means 10% of the samples taken from Huntington Beach contained more lead.
While Huntington Beach water testing may have found 0.007 mg/L of lead in its water, that does not mean your water source has the same amount. The amount of lead in water in a city can vary greatly from neighborhood to neighborhood, or even building to building. Many buildings, particularly older ones, have lead pipes or service lines which can be a source of contamination. To find out if your home has lead, we recommend getting you water tested.
No amount of lead in water is healthy, only less dangerous. As lead accumulates in our bodies over time, even exposure to relatively small amounts can have negative health effects. For more information, please check out our Lead FAQ page.
Are there PFAS in Huntington Beach Tap Water?
Currently, testing tap water for PFAS isn’t mandated on a national level. We do have a list of military bases where there have been suspected or confirmed leaks. There appears to be at least one military base - Joint Forces Training Base - near Huntington Beach with suspected leaks.
With many potential sources of PFAS in tap water across the US, the best information we currently have about which cities have PFAS in their water is this ewg map, which you can check to see if Huntington Beach has been evaluated for yet.
Our stance is better safe than sorry, and that it makes sense to try to purify the tap water just in case.
What do these Violations Mean?
Safe Drinking Water Act Violations categories split into two groups, health based, and non-health based. Generally, health based violations are more serious, though non-health based violations can also be cause for concern.
Health Based Violations
- Maximum contaminant levels (MCLs) - maximum allowed contaminant level was exceeded.
- Maximum residual disinfectant levels (MRDLs) - maximum allowed disinfectant level was exceeded.
- Other violations (Other) - the exact required process to reduce the amounts of contaminants in drinking water was not followed.
Non-Health Based Violations
- Monitoring and reporting violations (MR, MON) - failure to conduct the required regular monitoring of drinking water quality, and/or to submit monitoring results on time.
- Public notice violations (Other) - failure to immediately alert consumers if there is a serious problem with their drinking water that may pose a risk to public health.
- Other violations (Other) - miscellaneous violations, such as failure to issue annual consumer confidence reports or maintain required records.
SDWA Table Key
| Field | Description |
|---|---|
| Compliance Period | Dates of the compliance period. |
| Status |
Current status of the violation.
|
| Health-Based? | Whether the violation is health based. |
| Category Code |
The category of violation that is reported.
|
| Code | A full description of violation codes can be accessed in the SDWA_REF_CODE_VALUES (CSV) table. |
| Contaminant Code | A code value that represents a contaminant for which a public water system has incurred a violation of a primary drinking water regulation. |
| Rule Code |
Code for a National Drinking Water rule.
|
| Rule Group Code |
Code that uniquely identifies a rule group.
|
| Rule Family Code |
Code for rule family.
|
For more clarification please visit the EPA's data dictionary.
Huntington Beach Water - Frequently Asked Questions
| By Phone: | 714-536-5503 |
| By Email: | alvin.papa@surfcity-hb.org |
| By Mail: | 19001 Huntington St. HUNTINGTON BEACH, CA, 92648 |
Existing customers can login to their City of Huntington Beach account to pay their Huntington Beach water bill by clicking here.
If you want to pay your City of Huntington Beach bill online and haven't made an account yet, you can create an account online. Please click here to create your account to pay your Huntington Beach water bill.
If you don't want to make an account, or can't remember your account, you can make a one-time payment towards your Huntington Beach water bill without creating an account using a one time payment portal with your account number and credit or debit card. Click here to make a one time payment.
Moving to a new house or apartment in Huntington Beach means you will often need to put the water in your name with City of Huntington Beach. In order to put the water in your name, please click the link to the start service form below. Start service requests for water bills typically take two business days.
Leaving your house or apartment in Huntington Beach means you will likely need to take your name off of the water bill with City of Huntington Beach. In order to take your name off the water bill, please click the link to the stop service form below. Stop service for water bills requests typically take two business days.
The estimated price of bottled water
$2.12 in USD (1.5-liter)
USER SUBMITTED RATINGS
- Drinking Water Pollution and Inaccessibility
- Water Pollution
- Drinking Water Quality and Accessibility
- Water Quality
The above data is comprised of subjective, user submitted opinions about the water quality and pollution in Huntington Beach, measured on a scale from 0% (lowest) to 100% (highest).
Related FAQS
Huntington Beach Water Quality Report (Consumer Confidence Report)
The EPA mandates that towns and cities consistently monitor and test their tap water. They must report their findings in an annual Consumer Confidence Report. Below is the most recent water quality report from Huntington Beach's Water. If you would like to see the original version of the report, please click here.
Annual Drinking
Annual Water Quality Report
• Quality
• Value
• Reliability
City of
HUNTINGTON BEACH
Utilities Division
This report contains important information about your drinking water.
If you do not understand it, speak with someone who can explain it.
Este informe contiene información muy importante sobre su agua potable.
Para mas información ó traducción, favor de contactar a
Customer Service Representative. Telefono: (714)
The
Colorado
River
Constant Monitoring Ensures Continued Excellence
Through drinking water quality testing programs carried out by the Orange County Water District (OCWD) for groundwater, the Metropolitan Water District of Southern California (MWDSC)
for treated surface water and the City of Huntington Beach for the water distribution system, your drinking water is constantly monitored from source to tap for constituents that are regulated and unregulated.
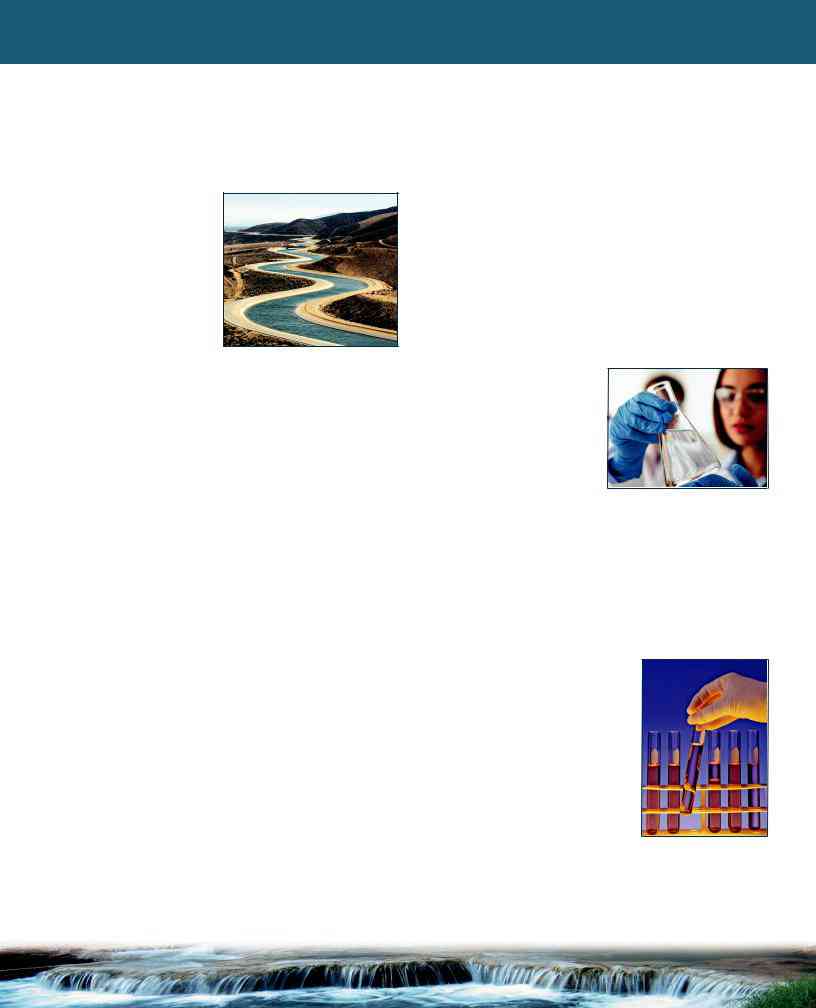
Sources of Supply
The City’s water supply is a blend of groundwater from nine City wells, and locally treated imported water originating from northern California and the Colorado River by MWDSC via the Municipal Water
District of Orange County (MWDOC) through three imported water connections. Groundwater comes from a natural underground aquifer that is replenished with water from the Santa Ana River, local rainfall, Groundwater Replenishment System (GWRS) recycled water, and imported water. The groundwater basin, which is managed by OCWD, is about 350 square miles. It lies beneath north and central Orange County, from Irvine to the Los Angeles County border and from Yorba Linda to the Pacific Ocean. More than 19 cities and retail water districts draw from the basin to provide water to homes and businesses.
In 2020, City of Huntington Beach source water consisted of 77% local groundwater and 23% imported treated surface water. Huntington Beach also has emergency water connections with the neighboring cities of Fountain Valley, Seal Beach, and Westminster.
Orange County’s Water Future
For years, Orange County has enjoyed an abundant, seemingly endless supply of
OCWD implements and operates new and innovative water management and supply development programs, including water recycling, wetlands and recharge facility expansion, groundwater cleanup projects, storage programs, and water education programs for children through adults. MWDOC offers rebates and incentives to promote
Your local and regional water agencies are committed to
making the necessary investments in new water management projects today to ensure an abundant and
Basic Information About
Drinking Water Contaminants
The sources of drinking water (both tap water and bottled water) include rivers, lakes, streams, ponds, reservoirs, springs and underground aquifers. As water travels over the surface of the land, or through the layers of the earth, it dissolves naturally occurring minerals and, in some cases, radioactive material, and can pick up substances resulting from the presence of animal and human activity.
Contaminants that may be present in source water include:
- Microbial contaminants, such as viruses and bacteria, may come from sewage treatment plants, septic systems, agricultural livestock operations and wildlife.
- Pesticides and herbicides may come from a variety of sources such as agriculture, urban storm- water runoff and residential uses.
-
Inorganic contaminants, such as salts and metals, can be naturally occurring or result from urban
storm runoff, industrial or domestic wastewater discharges, oil and gas production, mining and farming. -
Organic chemical contaminants, including synthetic and volatile organic chemicals, are
by-products of industrial processes and petroleum production, and can also come from gasoline stations, urban stormwater runoff, agricultural use and septic systems. - Radioactive contaminants can be naturally occurring or the result of oil and gas production or mining activities.
In order to ensure that tap water is safe to drink, USEPA and the DDW prescribe regulations that limit the
amount of certain contaminants in water provided by public water systems.
The U.S. Food and Drug Administra- tion regulations and California law also establish limits for contaminants in bottled water that must provide the same protection for public health. Drinking water, including bottled water, may reasonably be expected to contain at least small amounts of some contami-
nants. The presence of contaminants does not necessarily indicate that water poses a health risk.
More information about contaminants and potential health effects can be obtained by calling the USEPA’s Safe Drinking Water Hotline at (800)
~ 3 ~
To Safeguard Against Issues that May Affect Your Health
We Comply with All State & Federal Water Quality Regulations
|
Disinfectants and |
treated with chlorine. In 1979, the USEPA set the maximum |
|||||||
|
Disinfection Byproducts |
amount of total THMs allowed in drinking water at 100 parts per |
|||||||
|
billion as an annual running average. In January 2002, the Stage 1 |
||||||||
|
Disinfection of drinking water was one |
||||||||
|
Disinfectants / Disinfection Byproducts Rule lowered the total |
||||||||
|
of the major public health advances in the |
||||||||
|
THM maximum annual average level to 80 parts per billion and |
||||||||
|
20th century. Disinfection was a major |
||||||||
|
added HAAs to the list of regulated chemicals in drinking water. |
||||||||
|
factor in reducing waterborne disease |
||||||||
|
Your drinking water complies with the Stage 1 Disinfectants / |
||||||||
|
epidemics caused by pathogenic bacteria |
||||||||
|
Disinfection Byproducts Rule. |
||||||||
|
and viruses, and it remains an essential part |
||||||||
|
|
Stage 2 of the regulation was finalized by USEPA in 2006, |
|||||||
|
of drinking water treatment today. |
|
|||||||
|
which further controls allowable levels of DBPs in drinking water |
||||||||
|
|||||||||
Chlorine disinfection has almost completely eliminated the |
|||||||||
without compromising disinfection itself. A required distribution |
|||||||||
risks of microbial waterborne diseases from our lives. Chlorine is |
|||||||||
system evaluation was completed in 2008 and a Stage 2 |
|||||||||
added to your drinking water at the source of supply (groundwater |
|||||||||
monitoring plan has been approved by DDW. Full Stage 2 |
|||||||||
well or surface water treatment plant). Enough chlorine is added |
|||||||||
compliance began in 2012. |
|||||||||
so that it does not completely dissipate as it travels through the |
|||||||||
Chloramines |
|
||||||||
water distribution system. This “residual” chlorine helps to prevent |
|
||||||||
the growth of bacteria in the pipes that carry drinking water from |
|
Huntington Beach receives |
|
||||||
the source into your home or business. |
imported water from MWDSC |
|
|||||||
However, chlorine can react with |
which produces water that is |
|
|||||||
in the water to form unintended chemical byproducts, called |
treated with chloramines, a |
|
|||||||
disinfection byproducts (DBPs), which may pose health risks. |
combination of chlorine and |
|
|||||||
A major challenge is how to balance the risks from microbial |
ammonia, as its drinking water |
|
|||||||
|
|||||||||
pathogens and DBPs. It is important to provide protection from |
disinfectant. Chloramines are effective killers of bacteria and other |
||||||||
these microbial pathogens while simultaneously ensuring |
microorganisms that may cause disease. Chloramines form fewer |
||||||||
decreasing health risks from disinfection byproducts. The Safe |
disinfection |
||||||||
Drinking Water Act requires the USEPA to develop rules to achieve |
used properly. People who use kidney dialysis machines at home |
||||||||
these goals. |
|
may want to take special precautions and consult their physician |
|||||||
Trihalomethanes (THMs) and Haloacetic Acids (HAAs) are the |
for the appropriate type of water treatment. Customers who |
||||||||
most common and most studied DBPs found in drinking water |
maintain fish ponds, tanks or aquaria should also make necessary |
||||||||
|
|
|
|
|
adjustments in water quality treatment, as chloramines |
||||
|
|
|
|
|
|||||
We Invite You to |
or information or concerns about |
|
are toxic to fish. |
||||||
|
|
||||||||
Learn More About |
Fthis report, or your water quality in |
|
|
||||||
|
|||||||||
general, please contact Jon Erickson |
|
||||||||
Your Water’s Quality |
at (714) |
|
|||||||
|
|
|
|
|
|||||
|
|
to |
|
|
Immunocompromised People |
||||
may also address your concerns at the regularly scheduled City Council |
|
|
|
|
Some people may be more |
||||
meetings held at City Hall at 2000 Main Street in Huntington Beach |
|
|
|
|
|||||
|
|
|
vulnerable to contaminants in |
||||||
on the first and third Mondays of each month at 6:00 p.m. in the City |
|
|
|
||||||
|
|
|
drinking water than the general |
||||||
Hall Council Chambers, or at the monthly Public Works Commission |
|
|
|
||||||
|
|
|
population. Immunocompromised |
||||||
meeting held on the third Wednesday of every month at 5:00 p.m. |
|
|
|
|
|||||
|
|
|
|
people, such as those with cancer |
|||||
(refer to the City website — www.huntingtonbeachca.gov/ — for |
|
|
|
|
|||||
|
|
|
|
who are undergoing chemotherapy, |
|||||
location). Please feel free to participate in these meetings. The City |
|
|
|
|
|||||
|
|
|
|
persons who have had organ |
|||||
firmly believes in the public’s right to know as much as possible about |
|
|
|
||||||
|
|
|
transplants, people with HIV/AIDS |
||||||
the quality of their drinking water. Your input and concerns are very |
|
|
|
|
|||||
important to us. |
|
|
|
|
|
or other immune system disorders, |
|||
For more information about the health effects of the listed contami- |
|
|
|
some elderly persons and infants |
|||||
nants in the following tables, call the USEPA Safe Drinking Water |
|
|
|
|
can be particularly at risk to |
||||
Hotline at (800) |
|
infections. These people should seek advice about |
|||||||
|
|
|
|
|
drinking water from their health care providers. |
||||
~ 4 ~
About Lead in Tap Water
If present, elevated levels of lead can cause serious health problems, especially for pregnant women and young children. Lead in drinking water is primarily from materials and components associated with water service lines and home plumbing.
The City of Huntington Beach Utilities Division is responsible for providing high quality drinking water, but cannot control the variety of materials used in plumbing components. When your water has been sitting for several hours, you can minimize the potential for lead exposure by flushing your tap for 30 seconds to 2 minutes before using water for drinking or cooking.
If you are concerned about lead in your water, you may wish to have your water tested. Information on lead in drinking water, testing methods, and steps you can take to minimize exposure is available from the EPA Lead Info Center Hotline at (800)
Fluoridation
Fluoride occurs naturally in Huntington Beach’s water supplies. In addition to the natural levels, the City adds a small amount of fluoride to the water to promote dental benefits per a majority vote of the community during the early 1970s.
Fluoridation’s primary benefit is to help prevent tooth decay in children. Because of the dramatic health benefits of fluoridating drinking water, a 1997 Assembly Bill of the State of California mandated all large system water suppliers to begin fluoridating their systems.
The City’s water is fluoridated to the DDW optimal levels within a range of 0.6 to 1.2 parts per million (ppm).
For additional information about the fluoridation of drinking water, please visit:
Huntington Beach Utilities staff monitor daily to ensure the City’s water meets or exceeds all regulatory quality standards.
U.S. Centers for Disease Control and Prevention
State Water Resources Control Board, Division of Drinking Water
www.waterboards.ca.gov/drinking_water/certlic/
Huntington Beach Utilities staff collects one of the many daily water
samples used to test and verify the City’s water quality.
Chart Legend
What are Water Quality Standards?
Drinking water standards established by USEPA and DDW set limits for substances that may affect consumer health or aesthetic qualities of drinking water. The charts in this report show the following types of water quality standards:
- Maximum Contaminant Level (MCL): The highest level of a contaminant that is allowed in drinking water. Primary MCLs are set as close to the PHGs (or MCLGs) as is economically and technologically feasible.
- Maximum Residual Disinfectant Level (MRDL): The highest level of a disinfectant allowed in drinking water. There is convincing evidence that addition of a disinfectant is necessary for control of microbial contaminants.
- Secondary MCLs are set to protect the odor, taste, and appearance of drinking water.
- Primary Drinking Water Standard: MCLs for contaminants that affect health along with their monitoring and reporting requirements and water treatment requirements.
- Regulatory Action Level (AL): The concentration of a contaminant which, if exceeded, triggers treatment or other requirements that a water system must follow.
What is a Water Quality Goal?
In addition to mandatory water quality standards, USEPA and DDW have set voluntary water quality goals for some contaminants. Water quality goals are often set at such low levels that they are not achievable in practice and are not directly measurable. Nevertheless, these goals provide useful guideposts and direction for water management practices. The charts in this report include three types of water quality goals:
- Maximum Contaminant Level Goal (MCLG): The level of a contaminant in drinking water below which there is no known or expected risk to health. MCLGs are set by USEPA.
- Maximum Residual Disinfectant Level Goal (MRDLG): The level of a drinking water disinfectant below which there is no known or expected risk to health. MRDLGs do not reflect the benefits of the use of disinfectants to control microbial contaminants.
- Public Health Goal (PHG): The level of a contaminant in drinking water below which there is no known or expected risk to health. PHGs are set by the California Environmental Protection Agency.
How are Contaminants Measured?
Water is sampled and tested throughout the year. Contaminants are measured in:
- parts per million (ppm) or milligrams per liter (mg/L)
- parts per billion (ppb) or micrograms per liter (µg/L)
- parts per trillion (ppt) or nanograms per liter (ng/L)
~ 5 ~

2020 City of Huntington Beach Drinking Water Quality
Local Groundwater and Metropolitan Water District Treated Surface Water
|
|
|
Average |
Average |
|
|
|
|
|
PHG |
Local |
MWD |
Range of |
MCL |
Typical Source |
Chemical |
MCL |
(MCLG) |
Groundwater |
Surface Water |
Detections |
Violation? |
of Contaminant |
|
|
|
|
|
|
|
|
Radiologicals – Tested in 2020 |
|
|
|
|
|
|
|
Alpha Radiation (pCi/L) |
15 |
(0) |
ND |
<3 |
ND – 3 |
No |
Erosion of Natural Deposits |
Beta Radiation (pCi/L) |
50 |
(0) |
NR |
<4 |
ND – 7 |
No |
Decay of Natural and |
Uranium (pCi/L) |
20 |
0.43 |
3.15 |
2 |
ND – 7.49 |
No |
Erosion of Natural Deposits |
|
|
|
|
|
|
|
|
Inorganic Chemicals – Tested in 2020 |
|
|
|
|
|
|
|
Aluminum (ppm) |
1 |
0.6 |
ND |
0.137 |
ND – 0.26 |
No |
Treatment Process Residue, |
|
|
|
|
|
|
|
Natural Deposits |
Arsenic (ppb) |
10 |
0.004 |
<2.0 |
ND |
ND – 2 |
No |
Treatment Process Residue, |
|
|
|
|
|
|
|
Natural Deposits |
Barium (ppm) |
1 |
2 |
<0.1 |
0.107 |
ND – 0.107 |
No |
Refinery Discharge, |
|
|
|
|
|
|
|
Erosion of Natural Deposits |
Bromate (ppb) |
10 |
0.1 |
NR |
1.9 |
ND – 1.3 |
No |
Byproduct of Drinking Water Ozonation |
Fluoride (ppm) |
2 |
1 |
0.44 |
NR |
0.32 – 0.57 |
No |
Erosion of Natural Deposits |
Fluoride (ppm) |
2 |
1 |
0.79 |
0.7 |
0.369 – 1 |
No |
Water Additive for Dental Health |
Nitrate as N (ppm) |
10 |
10 |
<0.4 |
ND |
ND – 1.02 |
No |
Agriculture Runoff and Sewage |
Nitrate and Nitrite as N (ppm) |
10 |
10 |
<0.4 |
ND |
ND – 1.03 |
No |
Agriculture Runoff and Sewage |
|
|
|
|
|
|
|
|
Secondary Standards** – Tested in 2020 |
|
|
|
|
|
|
|
Aluminum (ppb) |
200** |
600 |
ND |
137 |
ND – 260 |
No |
Treatment Process Residue, |
|
|
|
|
|
|
|
Natural Deposits |
Chloride (ppm) |
500** |
n/a |
45.4 |
94 |
12.7 – 97.9 |
No |
Runoff or Leaching from Natural Deposits |
Color (color units) |
15** |
n/a |
1.1 |
1 |
ND – 10 |
No |
|
Manganese (ppb) |
50** |
n/a |
<20 |
ND |
ND – 29.7 |
No |
Runoff or Leaching from Natural Deposits |
Odor (threshold odor number) |
3** |
n/a |
1.8 |
2 |
ND – 32 |
No |
|
Specific Conductance (µmho/cm) |
1,600** |
n/a |
536 |
970 |
356 – 975 |
No |
Substances that Form Ions in Water |
Sulfate (ppm) |
500** |
n/a |
53 |
216 |
24 – 217 |
No |
Runoff or Leaching from Natural Deposits |
Total Dissolved Solids (ppm) |
1,000** |
n/a |
360 |
592 |
216 – 720 |
No |
Runoff or Leaching from Natural Deposits |
Turbidity (NTU) |
5** |
n/a |
0.2 |
ND |
ND – 0.7 |
No |
Runoff or Leaching from Natural Deposits |
|
|
|
|
|
|
|
|
Unregulated Chemicals – Tested in 2020 |
|
|
|
|
|
|
|
Alkalinity, total as CaCO3 (ppm) |
Not Regulated |
n/a |
149 |
118 |
111 – 181 |
n/a |
Runoff or Leaching from Natural Deposits |
Boron (ppm) |
NL = 1 |
n/a |
<0.1 |
0.13 |
ND – 0.13 |
n/a |
Runoff or Leaching from Natural Deposits |
Calcium (ppm) |
Not Regulated |
n/a |
60.2 |
66 |
22.6 – 119 |
n/a |
Runoff or Leaching from Natural Deposits |
Hardness, total as CaCO3 (ppm) |
Not Regulated |
n/a |
189 |
265 |
63.7 – 392 |
n/a |
Runoff or Leaching from Natural Deposits |
Hardness, total (grains/gallon) |
Not Regulated |
n/a |
11 |
15 |
4 – 23 |
n/a |
Runoff or Leaching from Natural Deposits |
Magnesium (ppm) |
Not Regulated |
n/a |
9.4 |
26 |
1.8 – 26 |
n/a |
Runoff or Leaching from Natural Deposits |
NL = 10 |
n/a |
ND |
3.1 |
ND – 3.1 |
n/a |
Byproduct of Drinking Water Chloramination, |
|
|
|
|
|
|
|
|
Industrial Processes |
pH (pH units) |
Not Regulated |
n/a |
8 |
8.1 |
7.8 – 8.2 |
n/a |
Hydrogen Ion Concentration |
Potassium (ppm) |
Not Regulated |
n/a |
2.7 |
4.6 |
1.8 – 4.7 |
n/a |
Runoff or Leaching from Natural Deposits |
Sodium (ppm) |
Not Regulated |
n/a |
50.6 |
96 |
34.8 – 98 |
n/a |
Runoff or Leaching from Natural Deposits |
Total Organic Carbon (ppm) |
TT |
n/a |
<0.3 |
2.4 |
ND – 2.7 |
n/a |
Various Natural and |
Vanadium (ppb) |
NL = 50 |
n/a |
<3 |
ND |
ND – 6.4 |
n/a |
Runoff or Leaching from Natural Deposits |
|
|
|
|
|
|
|
|
ppb =
NR = Not Required to be analyzed; ND = not detected; < = average is less than the detection limit for reporting purposes; MCL = Maximum Contaminant Level; (MCLG) = Federal MCL Goal; PHG = California Public Health Goal; NL = Notification Level; n/a = not applicable; TT = treatment technique
*The City of Huntington Beach and the Metropolitan Water District of Southern California add fluoride to the
The fluoride level in the treated water is maintained within an optimal range of 0.6 to 1.2 as required by the State Water Resources Control Board, Division of Drinking Water regulations. **Contaminant is regulated by a secondary standard.
Turbidity – combined filter effluent |
Treatment |
Turbidity |
TT |
Typical Source |
|
Metropolitan Water District Diemer Filtration Plant |
Technique |
Measurements |
Violation? |
of Contaminant |
|
|
|
|
|
|
|
1) |
Highest single turbidity measurement |
0.3 NTU |
0.04 |
No |
Soil Runoff |
2) |
Percentage of samples less than 0.3 NTU |
95% |
100% |
No |
Soil Runoff |
|
|
|
|
|
|
Turbidity is a measure of the cloudiness of the water, an indication of particulate matter, some of which might include harmful microorganisms. |
NTU = nephelometric turbidity units |
|
||||
Low turbidity in Metropolitan’s treated water is a good indicator of effective filtration. Filtration is called a ”treatment technique” (TT). |
|
|
||||
A treatment technique is a required process intended to reduce the level of chemicals in drinking water that are difficult and sometimes impossible to measure directly. |
|
|||||
|
|
|
||||
|
Unregulated Chemicals Requiring Monitoring |
|
||||
|
|
|
|
|
|
|
|
|
|
Average |
Average |
|
|
|
Notification |
|
Local |
MWD |
Range of |
Most Recent |
Chemical |
Level |
PHG |
Groundwater |
Surface Water |
Detections |
Sampling Date |
Bromide (ppm) |
n/a |
n/a |
0.25 |
NR |
0.076 – 0.785 |
2019 |
Germanium (ppb) |
n/a |
n/a |
0.04 |
0.1 |
ND – 0.4 |
2019 |
Manganese (ppb)*** |
50* |
n/a |
8.9 |
1.7 |
0.8 – 20.1 |
2019 |
Total Organic Carbon (Unfiltered) (ppm) |
n/a |
n/a |
0.26 |
NR |
0.06 – 0.7 |
2019 |
|
|
|
|
|
|
|
***Manganese was included as part of the unregulated chemicals requiring monitoring.
~ 6 ~
2020 City of Huntington Beach Distribution System Water Quality
|
MCL |
Average |
Range of |
MCL |
Typical Source |
|
Disinfection Byproducts |
(MRDL/MRDLG) |
Amount |
Detections |
Violation? |
of Contaminant |
|
Total Trihalomethanes (ppb) |
80 |
40 |
4.7 – 46 |
No |
Byproducts of chlorine disinfection |
|
Haloacetic Acids (ppb) |
60 |
14 |
1.8 – 18 |
No |
Byproducts of chlorine disinfection |
|
Chlorine Residual (ppm) |
(4 / 4) |
0.89 |
0.63 – 1.33 |
No |
Disinfectant added for treatment |
|
Aesthetic Quality |
|
|
|
|
|
|
Color (color units) |
15* |
<5 |
ND – 15 |
No |
Erosion of natural deposits |
|
Odor (threshold odor number) |
3* |
1.1 |
1 – 17 |
No |
|
|
Turbidity (NTU) |
5* |
0.11 |
ND – 1.05 |
No |
Erosion of natural deposits |
|
Eight locations in the distribution system are tested quarterly for total trihalomethanes and haloacetic acids; six locations are tested weekly for color, odor, and turbidity. MRDL = Maximum Residual Disinfectant Level; MRDLG = Maximum Residual Disinfectant Level Goal
*Contaminant is regulated by a secondary standard to maintain aesthetic qualities (taste, odor, color).
Lead and Copper Action Levels at Residential Taps
|
Action Level |
Public |
90th Percentile |
Sites Exceeding AL / |
AL |
Typical Source |
|
|
(AL) |
Health Goal |
Value |
Number of Sites |
Violation? |
of Contaminant |
|
|
|
|
|
|
|
|
|
Lead (ppb) |
15 |
0.2 |
7 |
1 out of 60 |
No |
Corrosion of household plumbing |
|
Copper (ppm) |
1.3 |
0.3 |
0.18 |
0 out of 60 |
No |
Corrosion of household plumbing |
|
Every three years, at least 50 selected residences are tested for lead and copper
Lead was detected in 14 samples, one of which exceeded the regulatory lead action level (AL). Copper was detected in 35 samples, none of which exceeded the copper AL.
A regulatory action level is the concentration of a contaminant which, if exceeded, triggers treatment or other requirements that a water system must follow.
In 2020, no school submitted a request to be sampled for lead.
Unregulated Chemicals Requiring Monitoring in the Distribution System
|
Notification |
|
Average |
Range of |
Most Recent |
Chemical |
Level |
PHG |
Amount |
Detections |
Sampling Date |
|
|
|
|
|
|
Bromochloroacetic Acid (ppb) |
n/a |
n/a |
3.2 |
0.8 – 7.6 |
2019 |
Bromodichloroacetic Acid (ppb) |
n/a |
n/a |
1.5 |
ND – 3 |
2019 |
Chlorodibromoacetic Acid (ppb) |
n/a |
n/a |
1.2 |
0.6 |
2019 |
Dibromoacetic Acid (ppb) |
n/a |
n/a |
2.3 |
1.2 – 7 |
2019 |
Dichloroacetic Acid (ppb) |
n/a |
MCLG = 0 |
3.2 |
ND – 6.2 |
2019 |
Monobromoacetic Acid (ppb) |
n/a |
n/a |
0.12 |
ND – 0.9 |
2019 |
Tribromoacetic Acid (ppb) |
n/a |
n/a |
0.3 |
ND – 2.7 |
2019 |
Trichloroacetic Acid (ppb) |
n/a |
MCLG = 20 |
1.2 |
ND – 2.1 |
2019 |
Source Water Assessments
Imported (MWDSC) Water Assessment
Every five years, MWDSC is required by DDW to examine possible sources of drinking water contamination in its State Water Project and Colorado River source waters.
The most recent watershed sanitary survey of its source water
supplies from the Colorado River was
updated in 2015 and the State Water
Project was updated in 2016.
Water from the Colorado River is
considered to be most vulnerable to contamination from recreation,
urban/stormwater runoff, increasing
urbanization in the watershed, and wastewater. Water supplies from Northern California’s State Water Project are most vulnerable to contamination from urban/stormwater runoff, wildlife, agriculture, recreation, and wastewater.
USEPA also requires MWDSC to complete one Source Water Assessment (SWA) that utilizes information collected in the watershed sanitary survey. MWDSC completed its SWA in
December 2002. The SWA is used to evaluate the vulnerability of water sources to contamination and helps determine whether more protective measures are needed.
A copy of the most recent summary of either Watershed Sanitary Survey or the SWA can be obtained by calling MWDSC at
(800)
Groundwater Assessment
An assessment of the groundwater sources for Huntington Beach was completed in December, 2002. The ground-
water sources are considered most vulnerable to the
following activities not associated with detected contaminants: dry cleaners, electrical/electronic manufacturing, gas stations, known contaminant plumes, metal plating, finishing, or fabricating, military installations and plastics/synthetics producers.
You may request a summary of the assessment by contacting Alvin Papa, the City’s Deputy Director of Public Works Utilities, at (714)
~ 7 ~
Shasta
TrinityLake
Lake
REDDING
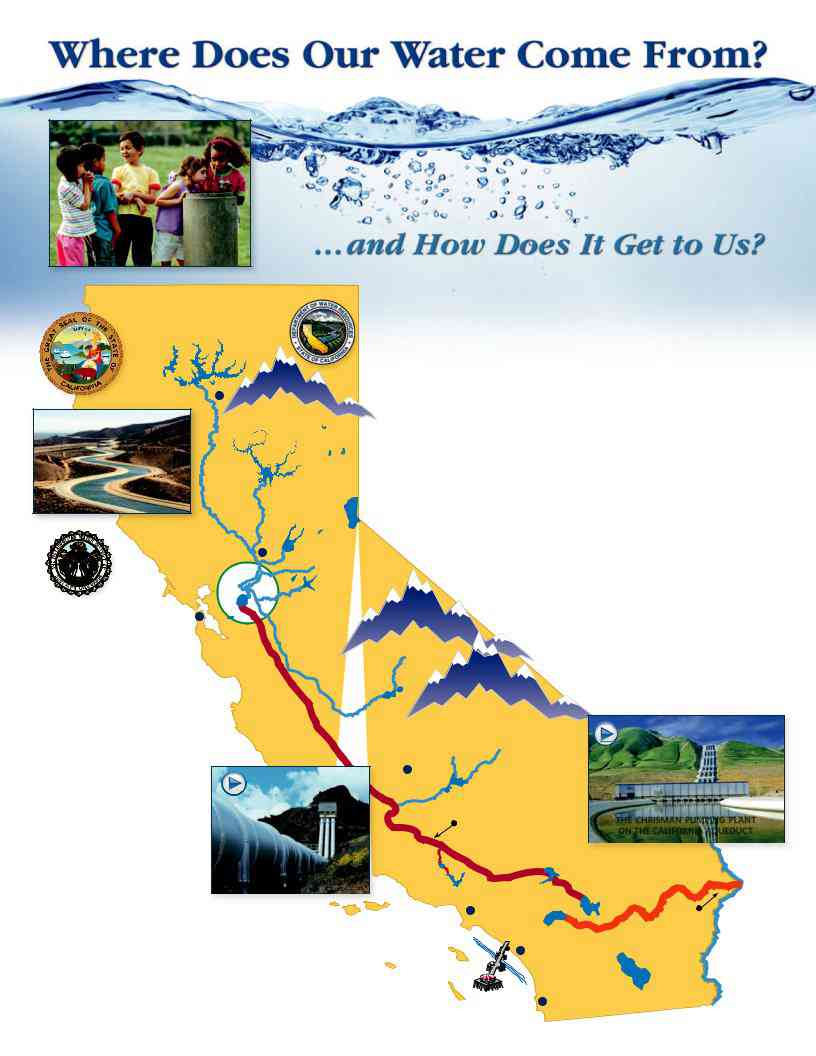
Have you ever wondered where your water comes from? Here in the City of Huntington Beach our water is drawn from local groundwater supplies then blended with water imported from both Northern California and the Colorado River.
Water from Northern California travels to us through a complex delivery system known as the California State Water Project. Designed and built in the 1960s, the State Water Project is one of the largest public water and power utilities in the world, providing drinking water for more than 25 million people statewide.
THE |
|
|
|
Managed by the California Department of Water Resources, the project stretches |
|||
CALIFORNIA |
|
|
|
over 700 miles, from Lake Oroville in the north to Lake Perris in the south. Water |
|||
AQUEDUCT |
|
|
|
||||
|
|
Lake |
|
stored in Lake Oroville, Folsom Lake, and other tributaries, and fed by snow melt |
|||
|
Oroville |
|
|||||
|
|
from the Sierra Nevada Mountains, flows into the Sacramento and San Joaquin |
|||||
|
|
|
|
||||
|
|
|
Feather |
rivers, and from there into reservoirs in the |
|||
Sacramento |
|
River |
From the |
||||
|
|
||||||
River |
|
|
|||||
|
|
Aqueduct, there to flow southward to cities and farms in Central and Southern |
|||||
|
|
|
Folsom |
||||
SACRAMENTO |
|
|
|
||||
Lake |
California. Composed mainly of |
||||||
|
|
|
New |
|
includes over 20 miles of tunnels, more than 130 miles of pipelines, |
||
|
|
|
Hogan |
|
and 27 miles of siphons. Along the way, the water is pumped |
||
|
|
|
Reservoir |
|
|||
|
|
|
|
|
|
||
Managed by the Metropolitan |
|
|
The |
|
2,882 feet over the Tehachapi Mountains. The Edmonston |
||
|
|
|
|||||
Water District of Southern |
|
|
|
Pumping Plant alone lifts millions of gallons a day up |
|||
|
|
|
|
||||
California, the Colorado River |
SAN |
San |
|
1,926 feet, the highest single water lift in the world. |
|||
Joaquin |
|
||||||
Aqueduct begins near Parker Dam |
FRANCISCO |
|
|
|
|||
River |
|
Is it any wonder the State Water Project is the |
|||||
|
|
|
|||||
|
|
|
|
||||
on the Colorado River. There, the |
|
|
Millerton |
||||
|
|
largest single consumer of power in the |
|||||
Gene Pumping Station lifts the water |
|
Lake |
|||||
|
|
|
|||||
|
|
|
State of California? |
||||
over 300 feet as it begins its 242 mile |
|
|
|
||||
|
|
|
|
|
|||
journey to Lake Mathews, just outside |
|
California Aqueduct |
|
||||
the City of Corona. Along the way, the water |
STATE WATER PROJECT |
|
|||||
|
|
|
|
||||
passes through two reservoirs, five |
|
|
|
|
|
|
|
pumping stations, 62 miles of |
|
|
BAKERSFIELD |
Lake |
|
||
|
|
|
|
Isabella |
|
||
canals, and 176 miles of tunnels, |
|
|
|
|
|
||
|
|
|
|
|
|
||
buried conduits and siphons. All |
|
|
|
|
Chrisman |
||
told, the water is lifted four times, |
|
|
|
|
Pumping |
||
|
|
|
|
Plant |
|||
|
|
|
|
|
|
||
a total of more than 1,300 feet. |
|
|
|
|
Silverwood |
Colorado |
|
After its journey across the Mojave |
Pyramid |
Lake |
Aqueduct |
||||
|
|||||||
Lake |
Castaic |
||||||
|
|||||||
Desert, the water descends into |
|
Lake |
|||||
|
|
||||||
|
|
|
|
Lake |
|||
|
|
|
|
LOS |
Perris |
||
the Coachella Valley and through the San Gorgonio Pass. |
|
||||||
|
|
||||||
|
ANGELES |
Gene |
|||||
Near Cabazon, the aqueduct flows underground, passing beneath |
P A C I F I C |
|
Pumping |
||||
Lake |
Station |
||||||
the San Jacinto Mountains and continuing until it reaches its |
O C E A N |
Mathews |
Colorado |
||||
ORANGE |
|||||||
terminus at Lake Mathews. From there, 156 miles of distribution lines, |
|
||||||
|
River |
||||||
|
COUNTY |
||||||
|
|
||||||
along with eight more tunnels and five drinking water treatment plants, |
|
|
|||||
delivers treated water throughout Southern California. |
|
SAN |
|
||||
|
|
|
|
|
DIEGO |
|
|
Water from State Water Project
|
Reservoir |
Colorado River |
|
|
|
|
Aqueduct |
|
|
|
|
|
Water |
Santa |
Water |
|
|
Ana |
|
|
|
Disinfection |
River |
|
Treatment |
Metropolitan |
|
Facility |
|
Plant |
|
|
|
|
Water District |
Well |
Percolation Pond |
|
|
|
|
|||
|
of Southern California |
(for Orange County Water District Groundwater Basin) |
||
|
(via MWD of Orange County) |
|
||
|
|
|
|
|
Storage
Tank
Commercial Building
The City of Huntington Beach Utilities Division vigorously works to ensure the safety of your drinking water and, in conjunction with MWDSC and OCWD, continuously monitors the water to verify adherence with drinking water regulations.
How Does Our Water Get to Us?
Importing water from hundreds of miles away is only the start to providing you clean, fresh water. Once the water is in the southland, the Metropolitan Water District of Southern California, in partnership with the Municipal Water District of Orange County, treats and pumps the water to individual cities throughout Orange County. The Orange County Water District, which manages the groundwater basin beneath Central and Northern Orange County, ensures the quality and supply of groundwater throughout its service area. The City of Huntington Beach sits atop the county aquifer and draws water from this local source, then blends it with the imported surface water.
Big Bear |
San Bernardino |
Cascading from its source high in the San Bernardino |
|
||
Reservoir |
|
||||
|
Mountains |
Mountains, the Santa Ana River is fed by a watershed |
|||
|
|
over 2,500 square miles in area. River water is |
|
||
|
|
|
captured behind Prado Dam and slowly released |
||
|
|
Seven to help replenish the Orange County Groundwater |
|||
|
|
Oaks |
Basin. Percolation ponds in Anaheim and Orange |
||
|
Wetlands |
Dam |
|||
|
|
hold this water so it can seep into the basin. |
|
||
|
|
|
|
||
|
Prado |
|
|
|
|
|
Dam |
|
|
|
|
|
|
|
|
Drinking Water |
To |
|
|
Santa Ana River |
Ocean |
||
|
|
Supply Well |
➥ |
||
Percolation
Ponds
Orange County
Groundwater Basin
(Aquifer)
The Need to Conserve Water Remains A High Priority Throughout California
Southern California has an arid climate and wise water use needs to become a part of everyone’s daily lives. For as finite as our water resources are, they get smaller every year. Simple water saving acts like the ones listed here can save countless gallons of water every day.
Soak pots and pans instead of letting water run while you scrub them clean. This both saves water and makes the job easier.
Keep a pitcher of drinking water in the refrigerator. This can save
gallons of water every day and it’s always cold!
Plug the sink instead of running water to rinse your razor or wet
your toothbrush. This can save upwards of 300 gallons of water a
month.
Use a broom instead of a hose to clean off sidewalks and
driveways. It takes very little time to sweep and the water savings quickly adds up.
Check your sprinkler system for leaks, overspray, and broken
sprinkler heads and repair promptly. This can save countless
gallons each time you water.
Water plants in the early morning. It reduces evaporation and
ensures deeper watering.
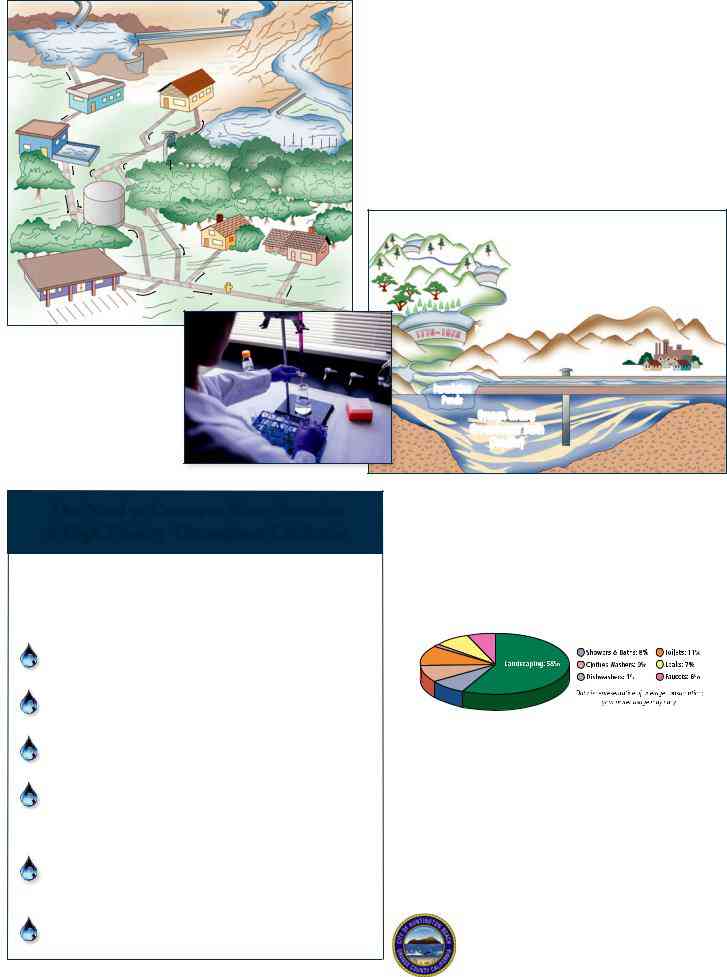
Where Do We Use Water the Most?
Outdoor watering of lawns and gardens makes up approxi- mately 60% of home water use. By reducing your outdoor water use — by either cutting back on irrigation or planting more drought tolerant landscaping — you can dramatically reduce your overall water use.
Save the most where you use the most:
Make your outdoor use efficient.
Where Can You Learn More?
There’s a wealth of information on the internet about Drinking Water Quality and water issues in general. Some good sites to begin your own research are:
Metropolitan Water District of So. California: www.mwdh2o.com California Department of Water Resources: www.water.ca.gov The Water Education Foundation: www.watereducation.org
To learn more about Water Conservation & Rebate Information: www.bewaterwise.com • www.ocwatersmart.com
And to see the Aqueducts in action, checkout these two videos: Wings Over the State Water Project: youtu.be/8A1v1Rr2neU Wings Over the Colorado Aqueduct: youtu.be/KipMQh5t0f4
City of Huntington Beach Utilities Division
2000 Main Street • Huntington Beach, California 92648
(714)
Contaminants
City of Huntington Beach
EWG's drinking water quality report shows results of tests conducted by the water utility and provided to the Environmental Working Group by the California State Water Resources Control Board, as well as information from the U.S. EPA Enforcement and Compliance History database (ECHO). For the latest quarter assessed by the U.S. EPA (January 2019 - March 2019), tap water provided by this water utility was in compliance with federal health-based drinking water standards.
Utility details
- Serves: 201000
- Data available: 2012-2017
- Data Source: Purchased surface water
- Total: 23
Contaminants That Exceed Guidelines
- 1%2C4-Dioxane
- Arsenic
- Bromodichloromethane
- Bromoform
- Chloroform
- Chromium (hexavalent)
- Dibromochloromethane
- Dichloroacetic acid
- Nitrate
- Nitrate and nitrite
- Total trihalomethanes (TTHMs)
- Trichloroacetic acid
- Uranium
Other Detected Contaminants
- Barium
- Bromide
- Chlorate
- Dibromoacetic acid
- Fluoride
- Haloacetic acids (HAA5)
- Manganese
- Molybdenum
- Strontium
- Vanadium
Reminder
Always take extra precautions, the water may be safe to drink when it leaves the sewage treatment plant but it may pick up pollutants during its way to your tap. We advise that you ask locals or hotel staff about the water quality. Also, note that different cities have different water mineral contents.
Sources and Resources
Sources Cited
Additional Resources
Huntington Beach Tap Water
My previous experience with Huntington Beach Tap Water was a great one. I had gone to a party at my friend’s house that night, and she asked if I would like some tap water for a soak. Sure, I said, why not. I loaded up my jug and went to take a long relaxing bath while drinking the sweet-tasting water. I came out of the bath refreshed, and I was ready to play some poker with my friends when suddenly I felt a strong and unmistakable tingling sensation in my head. I quickly looked down to see that I had a massive headache and wondered what was wrong.
Was it the chlorine? Maybe the dehydration? No, it was something else. As I continued to stare at the water in front of me, an extraordinary feeling began to wash over me. It was as if some invisible force was tugging on my temples and forcing them to swell with every drink I took.
When I finally realized what was going on, I quickly got out of the tub and went outside to see if I could figure out where this water had come from. As it turned out, it was coming from a nearby lake that was releasing fish into the water regularly. I immediately called my friend and asked her what she thought might be causing this problem, and she told me that several birds frequent the area and that they must be picking up the seeds from these birds’ droppings. So now I have a new hobby…sucking up bird poop!
Huntington Beach Drinking Water
As a Huntington Beach resident, I am very much aware of the importance of clean, safe, and reliable drinking water. Unfortunately, this is a resort town. All too often, you see the news reports concerning the pollution in local streams and rivers or the contamination of local lakes and bays by irresponsible city residents. Of course, most of these irresponsible city residents are voted in by their political leaders. Still, I find that many who live and work on the shore are just as concerned about the quality of local drinking water as much as those living inland. After all, we all need to take responsibility for our health!
I contend that there are three significant problems with the drinking water supply of Huntington Beach. First of all, there is a concern about bacterial contamination of local streams and rivers. The problem is the large numbers of untreated fecal coliform bacteria in our local rivers and streams. These bacteria grow and breed in the warm, moist conditions encountered by marine life as they feed on the algae that cover the water’s bottom.
Second, the chlorine that is added to our tap water in massive amounts is a serious threat to the health of every citizen who uses this municipal water supply. While it kills bacteria, it is also a potent carcinogen that contributes to cancerous growth. Finally, while it kills bacteria, it does not kill viruses, which means that we are dealing with a host of potentially harmful issues here. My goal has always been to try to help find alternate sources for my drinking water, which is why I have recently become involved with a new company that has been making a remarkable breakthrough in the field of filtration technology.
Huntington Beach Water Quality
You are probably aware that the water at Huntington Beach, California, is considered to be among the best in the nation and that you can enjoy some of the best fishing and snorkeling in the world. But did you know that it has also been ranked as one of the nation’s most polluted places? This article will take a brief look at what is involved in this ranking.
Huntington Beach is one of the cities in Southern California that receive an influx of tourists from all over the world each year. Unfortunately, a lot of this tourist influx is made up of people who do not have good water quality in their homes, hotels, and businesses. Some of these people tend to end up drinking water that is not fit to drink because they are used to it. It is sad to think about how much pollution is out there in the water that is meant to make your life easier and taste better. If you own a business or a home in the area, you need to make sure that you have the best quality equipment, filters, and water purifiers that you can afford. Doing this will benefit you in many different ways.
For instance, you will have more customers due to having clean, fresh water to serve your guests. This means that your beach resort or hotel will be filled with people who are ready to have fun and have a great time. It is also a good thing for the environment, which is always essential to think about when you are thinking about doing something that impacts the world around you. In addition to ensuring that you have the right equipment to use, you need to make sure that you filter the water not to end up back in the ocean. You may not realize this, but the fish that you catch and bring home to your dinner table are affected by the water quality that you have.
Huntington Beach Drinking Water Quality
Recently I attended a seminar in California on the subject of Huntington Beach’s drinking water quality. My appearance was somewhat controversial because the director of the California Environmental Protection Agency at the time, Barbara Walworth, is an appointee of the pro-business lobby group, The Pacific Institute, and has been attacking my work on the high degree of fluoride contamination in our public water supplies. She is widely considered to be an expert on the subject. She has been trying to undermine my work for years. I attended the seminar because I wanted to learn more about the mysterious cases of cancer that are often attributed to cryptosporidium and giardia consumption.
At the seminar, I listened to one of the experts on the subject, Dr. William Trautman, a world-renowned forensic pathologist. Dr. Trautman indicated there is a definite link between cancer and the consumption of cryptosporidium or giardia. He also stated that the amount of chlorine added to the water supplies found in almost all of the country’s major cities is too much. Unfortunately, many people do not realize that chlorine is added to drinking water to taste better. Still, it can damage the human body over time due to its chlorine disinfection abilities.
There are several additional reasons that the water quality of our homes is so poor. Several chemicals are routinely added to our groundwater at the municipal level. As you know, if you have a garden, they are often sprayed onto your vegetables, fruits, and even plants. These chemical fertilizers are, in fact, so dangerous that some homeowners have had to pay significant fines to remove them from their property. If your municipality isn’t required to test for these carcinogenic substances, I highly recommend that you insist that they do so. Your local water authority needs to protect you and your family; doing your research will be an excellent investment.
Huntington Beach Water District
The Huntington Beach Water District provides various boating experiences, including chartering, powerboats, and other watercraft rentals. The water is calm and clear, and the wildlife is plentiful. If you are interested in seeing the creatures that live underwater, the Sea Life Park is open from April through October. In this three-acre park, visitors can view several tropical fish species, including King Salmon, Shortfin Tuna, and Cobia fish. You can also enjoy a variety of shallow sea creatures like lobsters and crabs.
If you are looking for excitement, you can check out the Top Secret Island Lodge. Located on a private island in Laguna Beach, the lodge offers an assortment of outdoor activities for all ages. The beach itself offers a wide array of family activities, including boating, surfing, and jet skiing. You can also go hiking and experience nature up close. The hotel’s pool is heated year-round for use by guests.
Many hotels, pubs, and restaurants can be found in the Huntington Beach Water District, which offers many local attractions, restaurants, and nightlife options. If you would prefer to stay indoors, you can find accommodations at one of the area’s hotels. Hotels include the Days Inn on Ocean Boulevard, the Surf and Sand Hotel in Laguna Niguel, the Ramada Resort on Surfside, and the Surfside Suites by Hilton Huntington Beach. You can also book a room at one of the hotels if you plan on traveling out of town on occasion.
Huntington Beach Water Quality Report
The City of Huntington Beach has a water quality report that the State mandates. This is done yearly and gives a good idea of how clean your local supply of water is. Unfortunately, not all cities or counties have these reports available. If you are looking at having a good quality water supply coming into your home, there is no better time than now to start. There have been no significant water quality problems found in over twenty years, so this means it should not be an issue.
To view this report, you need first to locate your local county office. Once there, you will need to enter your zip code. Then you will be directed to a page where you can find the office’s address and all of the information you need. You can also call them if you have any further questions. You can also go online to find out more about your particular county, as well as the report itself.
The information found in this report is not only limited to the city of Huntington Beach. You can find the report for your county, too. If you are having issues with local supply, this is the most accessible place to turn. You can get the necessary information so that you can make decisions on where to source your water. No matter what kind of issues you are dealing with, you can find out what your local water quality report says.
Huntington Beach Water System
The water system of the city of Huntington Beach is imposing. It is one of the best water systems you will ever see in your life, and that’s because it works so well. For those who live on the east side of town, the water system is supplied by a human-made lake that feeds into the main sewer line and works along with the storm drain. But the whole system works exceptionally well, which means that you don’t have to worry about getting any clogs or packages or problems.
As far as the size of the lake, it is not very large. It is approximately five acres in size and has a depth of around sixteen feet. This means that it can cope with any normal-sized vacation home or even a tiny house with an above-ground pool. The system works perfectly well for dwellings as long as they are located on either side of the lake. A big levee on the north shore helps keep out any big waves from the ocean that would otherwise damage the system. All in all, this is a great system to have if you live on the East Coast.
For those who live on the Westside, then you will find that your water comes from the man-made Lake Lanier, which is fed by a sewer line that runs under a bridge over Boca Raton Creek. Your water bill will be higher, but not by a whole lot. You will, however, have to pay a little more for electricity and gas since it will use those two power sources for its function. Overall, this is a great water source for you to have in your home. You can get more information on the water system by clicking the link below.
Huntington Beach Water Supply
One of the most important things to look out for in a home in Huntington Beach, California, is the water supply. When it comes to water supply, there are many options, from a local septic company to a well-powered filter system. The type of plan you choose will depend on many different factors. Things like how far away you are from the nearest water supply and what kind of house you live in. There is no one-size-fits-all for the water supply, so you will need to speak with an expert if you have any concerns. Your local water company should be able to help you find a water source as long as it is accessible to them.
Many homes have a water supply hook-up to the community’s water tower powered by electricity, but many homes are solar-powered. If your home is powered by electricity or has a solar water system, you will have many different options to choose from in terms of how you get water. If you do not have these options, then you may have to look into how you can acquire water or have a water purifier placed in your home to purify it before you use it.
The water in Huntington Beach is very pure and safe to swim in. The water management department is also highly regulated to ensure that it is safe to use for recreational purposes. You may find that you cannot get water from the tap. If this is the case, you will have to find a company to supply you with clean filtered water.
Huntington Beach Water Resources
Huntington Beach is located on the beautiful California coast in the northern portion of Orange County and boasts a complete list of excellent public water resources for use by its citizens. Many areas along the coast receive treated city water, while those in the southern portion of the county are treated at the local treatment facility. Even though several areas receive treated water from Huntington Beach, the treatment plant itself provides some of the best-treated water in Southern California.
While Huntington Beach is proud of its water resources and treatments for those residents who wish to enjoy them, there are quite a few drawbacks to the water that is treated there. As noted above, this treatment plant uses a lot of salt to treat the water. However, the salt used in this particular plant can harm the lake’s marine life and can even pollute the air in the atmosphere above the water. Also, because so many salt deposits gather along the shoreline of the lake, this method of treating the water can create a significant amount of backwash along the coastline, which, in turn, harms the ecosystem further.
Unfortunately, the negative environmental impacts caused by the treatment plant itself don’t end there. In addition to the pollution in the atmosphere caused by the backwash and the salt used in the water, the wind that blows off the beaches also carries some of these pollutants offshore and into the ocean. These winds will bring some of this polluted air offshore and then be transported around the world as fine dust. As you can see, when it comes to Huntington Beach water supplies and beaches, the consequences can be pretty unpleasant.
Huntington Beach Wastewater
Located on the western end of the beautiful Orange County city of Huntington Beach, the wastewater treatment plant is responsible for treating large amounts of water that has fallen from the ocean. The water is usually pumped to this plant, placed in large containers or tanks, and kept under pressure to keep it moving. The water is treated to be used for drinking, fish farming, and industrial uses such as cleaning textile fibers. Unfortunately, since it’s such a large amount of water, there is also quite a bit of wastewater from washing machines, sprinkler systems, toilets, and even sewage treatment plants.
Over the past few decades, this water has proven to be one of the biggest offenders in the environmental health problems we have. Because of this, many local government bodies have worked hard to develop treatment methods for this highly toxic water. The result has been the development of many different wastewater treatment plants. These plants have been scattered around the county, with the largest being located in Newport Beach. One of the most significant issues with these plants is how the treated water is discharged into the ocean.
Many of the wastewater sent to the shorelines by local municipalities aren’t treated and ends up just backing up into the ocean. When the wastewater from these plants goes back out into the ocean, marine life has serious consequences. Fish don’t have the same protection from this wastewater as land animals do, which means that there are severe threats to the marine life that depend on these ocean currents for their food.