Table of Contents
Can You Drink Tap Water in Antioch?
Yes, Antioch's tap water is generally considered safe to drink as Antioch has no active health based violations of the Safe Drinking Water Act (SDWA) that we are aware of. Other factors such as lead piping in a home, or low levels of pollutants on immunocompromised individuals, should also be considered, however. To find more recent info we might have, you can check out our boil water notice page or the city's water provider website.
According the EPA’s ECHO database, from April 30, 2019 to June 30, 2022, Antioch's water utility, City of Antioch, had 0 violations of the Safe Drinking Water Act. For more details on the violations, please see our violation history section below. This assessment is based on the City of Antioch water system, other water systems in the city may have different results.
While tap water that meets the EPA health guidelines generally won’t make you sick to your stomach, it can still contain regulated and unregulated contaminants present in trace amounts that could potentially cause health issues over the long-run. These trace contaminants may also impact immunocompromised and vulnerable individuals.
The EPA is reviewing if it’s current regulations around pollutant levels in tap water are strict enough, and the health dangers posed by unregulated pollutants, like PFAS.
Water Quality Report for Antioch Tap Water
The most recent publicly available numbers for measured contaminant levels in Antioch tap water are in its 2020 Water Quality Report. As you can see, there are levels which the EPA considers to be acceptable, but being below the maximum allowable level doesn’t necessarily mean the water is healthy.
Lead in tap water, for example, is currently allowed at up to 15ppb by the EPA, but it has set the ideal goal for lead at zero. This highlights how meeting EPA standards doesn’t necessarily mean local tap water is healthy.
EPA regulations continue to change as it evaluates the long term impacts of chemicals and updates drinking water acceptable levels. The rules around arsenic, as well as, lead and copper are currently being re-evaluated.
There are also a number of "emerging" contaminants that are not currently. For example, PFAS (Per- and polyfluoroalkyl substances), for which the EPA has issued a health advisory. PFAS are called "forever chemicals" since they tend not to break down in the environment or the human body and can accumulate over time.
We recommend looking at the contaminants present in Antioch's water quality reports, or getting your home's tap water tested to see if you should be filtering your water.
Antioch Tap Water Safe Drinking Water Act Violation History - Prior 10 Years
Below is a ten year history of violations for the water system named City of Antioch for Antioch in California. For more details please see the "What do these Violations Mean?" section below.
Is there Lead in Antioch Water?
Based on the EPA’s ECHO Database, 90% of the samples taken from the Antioch water system, City of Antioch, between sample start date and sample end date, were at or below, 0.0 mg/L of lead in Antioch water. This is 0% of the 0.015 mg/L action level. This means 10% of the samples taken from Antioch contained more lead.
While Antioch water testing may have found 0.0 mg/L of lead in its water, that does not mean your water source has the same amount. The amount of lead in water in a city can vary greatly from neighborhood to neighborhood, or even building to building. Many buildings, particularly older ones, have lead pipes or service lines which can be a source of contamination. To find out if your home has lead, we recommend getting you water tested.
No amount of lead in water is healthy, only less dangerous. As lead accumulates in our bodies over time, even exposure to relatively small amounts can have negative health effects. For more information, please check out our Lead FAQ page.
Are there PFAS in Antioch Tap Water?
Currently, testing tap water for PFAS isn’t mandated on a national level. We do have a list of military bases where there have been suspected or confirmed leaks. There appears to be at least one military base - Rio Vista - near Antioch with suspected leaks.
With many potential sources of PFAS in tap water across the US, the best information we currently have about which cities have PFAS in their water is this ewg map, which you can check to see if Antioch has been evaluated for yet.
Our stance is better safe than sorry, and that it makes sense to try to purify the tap water just in case.
What do these Violations Mean?
Safe Drinking Water Act Violations categories split into two groups, health based, and non-health based. Generally, health based violations are more serious, though non-health based violations can also be cause for concern.
Health Based Violations
- Maximum contaminant levels (MCLs) - maximum allowed contaminant level was exceeded.
- Maximum residual disinfectant levels (MRDLs) - maximum allowed disinfectant level was exceeded.
- Other violations (Other) - the exact required process to reduce the amounts of contaminants in drinking water was not followed.
Non-Health Based Violations
- Monitoring and reporting violations (MR, MON) - failure to conduct the required regular monitoring of drinking water quality, and/or to submit monitoring results on time.
- Public notice violations (Other) - failure to immediately alert consumers if there is a serious problem with their drinking water that may pose a risk to public health.
- Other violations (Other) - miscellaneous violations, such as failure to issue annual consumer confidence reports or maintain required records.
SDWA Table Key
| Field | Description |
|---|---|
| Compliance Period | Dates of the compliance period. |
| Status |
Current status of the violation.
|
| Health-Based? | Whether the violation is health based. |
| Category Code |
The category of violation that is reported.
|
| Code | A full description of violation codes can be accessed in the SDWA_REF_CODE_VALUES (CSV) table. |
| Contaminant Code | A code value that represents a contaminant for which a public water system has incurred a violation of a primary drinking water regulation. |
| Rule Code |
Code for a National Drinking Water rule.
|
| Rule Group Code |
Code that uniquely identifies a rule group.
|
| Rule Family Code |
Code for rule family.
|
For more clarification please visit the EPA's data dictionary.
Antioch Water - Frequently Asked Questions
| By Phone: | 925-779-7029 |
| By Email: | zhylton@antiochca.gov |
| By Mail: | PO BOX 5007 ANTIOCH, CA, 94531-5007 |
Existing customers can login to their City of Antioch account to pay their Antioch water bill by clicking here.
If you want to pay your City of Antioch bill online and haven't made an account yet, you can create an account online. Please click here to create your account to pay your Antioch water bill.
If you don't want to make an account, or can't remember your account, you can make a one-time payment towards your Antioch water bill without creating an account using a one time payment portal with your account number and credit or debit card. Click here to make a one time payment.
Moving to a new house or apartment in Antioch means you will often need to put the water in your name with City of Antioch. In order to put the water in your name, please click the link to the start service form below. Start service requests for water bills typically take two business days.
Leaving your house or apartment in Antioch means you will likely need to take your name off of the water bill with City of Antioch. In order to take your name off the water bill, please click the link to the stop service form below. Stop service for water bills requests typically take two business days.
The estimated price of bottled water
$2.33 in USD (1.5-liter)
USER SUBMITTED RATINGS
- Drinking Water Pollution and Inaccessibility
- Water Pollution
- Drinking Water Quality and Accessibility
- Water Quality
The above data is comprised of subjective, user submitted opinions about the water quality and pollution in Antioch, measured on a scale from 0% (lowest) to 100% (highest).
Related FAQS
Antioch Water Quality Report (Consumer Confidence Report)
The EPA mandates that towns and cities consistently monitor and test their tap water. They must report their findings in an annual Consumer Confidence Report. Below is the most recent water quality report from Antioch's Water. If you would like to see the original version of the report, please click here.
YOUR
DRINKING
WATER
IN 2020
ANNUAL WATER
QUALITY REPORT
CONTRA COSTA WATER DISTRICT
Erin Gomez |
CITY OF ANTICOH
Laura Villasana |
CITY OF MARTINEZ
Hiren Patel |
CITY OF PITTSBURG
Ana Corti |
DIABLO WATER DISTRICT
Nacho Mendoza |
GOLDEN STATE WATER COMPANY (BAY POINT)
CITY OF BRENTWOOD
James Wolfe |
TO OUR CUSTOMERS:
We are pleased to present the Annual Water Quality Report that shows the high quality of your drinking water. As the water providers to more than 500,000 people, you can count on us to provide a reliable product that exceeds all drinking water standards set by the state and federal governments keeping our community healthy and thriving. We wisely put your water dollars to work investing in the systems and infrastructure that deliver a reliable supply of
You can be confident your tap water is of a high quality that is always there for you. Frequent testing for water quality and regular improvements in the treatment process keeps your drinking water among the best in the country.
We hope you find this report useful in illustrating the high quality of your water service. If you have questions about the tap water in your community, please use the list on the left to call your water provider.
SAFETY STANDARDS ENSURE QUALITY
The sources of drinking water (both tap water and bottled water) include rivers, lakes, streams, ponds, reservoirs, springs, and wells. As water travels over the surface of the land or through the ground, it dissolves
CONTAMINANTS THAT MAY BE PRESENT IN SOURCE WATER
Microbial contaminants include viruses and bacteria, that may come from sewage treatment plants, septic systems, agricultural livestock operations, and wildlife.
Inorganic contaminants include salts and metals that can be
Organic chemical contaminants include synthetic and volatile organic chemicals that are byproducts of industrial processes and petroleum production, and can also come from gas stations, urban stormwater runoff, agricultural application and septic systems.
Pesticides and herbicides may come from a variety of sources, such as agriculture, urban stormwater runoff and residential uses.
Radioactive contaminants can be naturally occurring or be the result of oil and gas production and mining activities.
In order to ensure that tap water is safe to drink, the U.S. Environmental Protection Agency (US EPA) and the State Water Resources Control Board (State Board) prescribe regulations that limit the amount of certain contaminants in water provided by public water systems. State Board regulations also establish limits for contaminants in bottled water that provide the same protection for public health.
Drinking water, including bottled water, may reasonably be expected to contain at least small amounts of some contaminants. The presence of contaminants does not necessarily indicate that water poses a health risk. More information about contaminants and potential health effects can be obtained by calling the US EPA’s Safe Drinking Water Hotline
None of the public water systems listed in this report produce or distribute bottled water. The State Division of Drinking Water mandates that the statements about bottled water be included in this report.
Your drinking water is continually sampled and analyzed. We perform tens of thousands of tests throughout the year to ensure your water is clean and safe to use.
IMPORTANT NOTICE
Some people may be more vulnerable to contaminants in drinking water than the general population. Immuno- compromised persons such as persons with cancer undergoing chemotherapy, persons who have undergone organ transplants, people with HIV/AIDS or other immune system disorders, some elderly, and infants can be particularly at risk from infections. These people should seek advice about drinking water from their health care providers. USEPA/Centers for Disease Control (CDC) guidelines
on appropriate means to lessen the risk of infection by Cryptosporidium and other microbial contaminants are available from the Safe Drinking Water Hotline at
2 2020 ANNUAL WATER QUALITY REPORT
WATER QUALITY NOTIFICATIONS
LEAD IN DRINKING WATER
No water provider included in this report detected lead above the regulatory action level in their water supply. If present, elevated levels of lead can cause serious health problems, especially for pregnant women and young children. Lead in drinking water is primarily from materials and components associated with service lines and plumbing in buildings and homes. Your drinking water supplier is responsible for providing high quality drinking water, but cannot control the variety of materials used in plumbing components. When your water has been sitting for several hours, you can minimize the potential for lead exposure by flushing your tap for 30 seconds to two minutes before using water for drinking or cooking. If you do so, you may wish to collect the flushed water and reuse it for another beneficial purpose, such as watering plants. If you are concerned about lead in your water, you may wish to have your water tested. Information on lead in drinking water, testing methods, and steps you can take to minimize exposure is available from the Safe Drinking Water Hotline at
LEAD MONITORING IN SCHOOLS
In early 2017, the State Board issued amendments to domestic water supply permits of community water systems so that kindergarten through 12th grade
To find out more about the Lead Sampling of Drinking Water in Schools initiative, visit waterboards.ca.gov/drinking_water/ certlic/drinkingwater/leadsamplinginschools.shtml.
The use of ozone disinfection results in drinking water that is very safe, with little taste and odor. Ozone effectively destroys potentially harmful microorganisms and, by breaking up the organic material often found in water, vastly improves the taste and odor of drinking water. In addition, ozone disinfection reduces the formation of many disinfection byproducts, such as trihalomethanes, a class of suspected
FLUORIDE
To prevent tooth decay, fluoride is added to your drinking water. This is a
Sedimentation basins in our water
treatment plants skim clean water from the top of the basin and allow heavy
organics to settle out at the bottom.
CRYPTOSPORIDIUM
Cryptosporidium is a microbial pathogen found in surface water throughout the U.S.
Although filtration removes Cryptosporidium, the most
guarantee 100 percent removal. Our monitoring indicates the presence of these organisms in our source
water and/or finished water. Current test methods do not allow us to determine if the organisms are dead or if they are capable of causing disease. Ingestion of Cryptosporidium may
cause cryptosporidiosis, an abdominal infection. Symptoms of infection include nausea, diarrhea, and abdominal cramps. Most healthy individuals can overcome the disease within a few weeks. However, immunocompromised people, infants and small children, and the elderly are at greater risk of developing
2020 ANNUAL WATER QUALITY REPORT 3
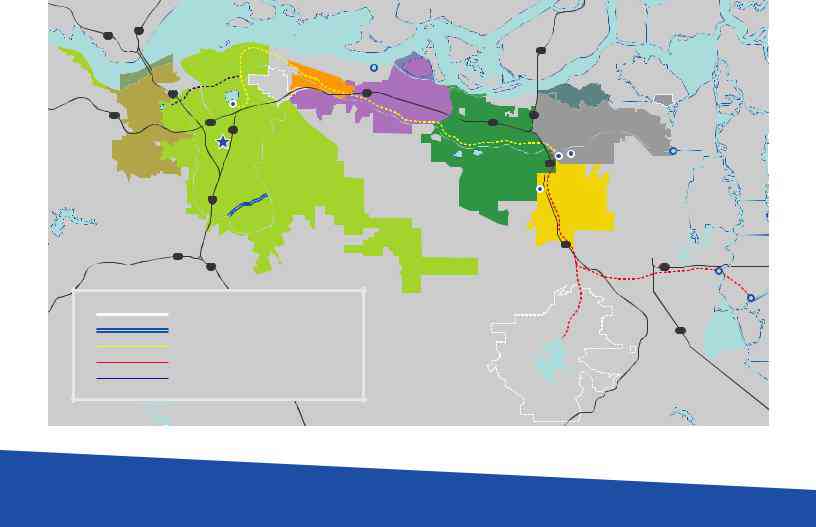
THE SOURCE OF YOUR WATER
Nearly every drop of water delivered by Contra Costa Water District originates in the
CONTRA COSTA WATER DISTRICT
CCWD provides treated drinking water to homes and businesses in Clayton, Clyde, Concord, Pacheco, Port Costa, and parts of Martinez, Pleasant Hill and Walnut Creek. Water is pumped from the Delta, treated and then delivered to customers through a network of distribution pipes.
CCWD completes watershed sanitary surveys every five years and the last one was completed in 2020. The surveys concluded that potential contamination is regularly mitigated by the natural flushing of the Delta, controls at contamination sources and existing water treatment practices.
In June 2002 and May 2003, source water assessments were conducted at the Old River, Rock Slough and Mallard Slough intakes, the Los Vaqueros, Contra Loma, Mallard and Martinez reservoirs, and the Contra Costa Canal at Clyde. A source water assessment was conducted for the Middle River Intake in 2012.
The assessments were based on a review of data collected from 1996 through 2001, as well as a review of the activities and facilities located at or near each source. In summary:
- Intakes were found to be most vulnerable to the effects of saltwater intrusion, agricultural drainage, recreational boating and regulated point discharges.
- Reservoirs were found to be most vulnerable to the effects of associated recreation, roads and parking lots, and watershed runoff.
- Contra Costa Canal was found to be most vulnerable to gas stations, chemical/petroleum processing/storage, septic systems, historic landfills and military institutions.
BAY POINT
The Golden State Water Company (GSWC) purchases treated water from CCWD and delivers it to customers through its distribution pipes. Water quality information for GSWC is not included in this report. View its water quality report at gswater.com/baypointccr.
BRENTWOOD
CCWD operates the CCWD/City of Brentwood’s water treatment plant to treat water for the City. Water quality information for Brentwood is not included in this report. View its water quality report at brentwoodca.gov/gov/pw/water/reports.asp.
|
|
|
|
|
|
|
|
|
|
|
|
HONKER |
|
680 |
|
|
|
|
|
|
|
|
|
|
|
BAY |
|
|
|
|
SUISUN BAY |
||||||||||
780 |
|
|
|
|
|||||||||
Port |
|
|
Port |
|
|
|
|
|
|
|
|
||
|
|
Chicago |
|
|
|
|
|
|
|
|
|||
Costa |
|
|
|
|
|
|
|
|
|
|
MALLARD |
||
|
|
|
|
Avon |
|
|
|
|
|
|
|
|
|
|
|
|
|
|
|
|
|
|
|
|
SLOUGH INTAKE |
||
|
|
|
|
|
|
|
|
|
|
|
|
|
|
|
|
|
|
|
Clyde |
|
|
|
|
GSWC |
|||
|
|
|
680 |
MALLARD |
4 |
||||||||
|
|
|
|
||||||||||
|
MARTINEZ |
|
RESERVOIR |
|
|
|
|
|
|
|
|
|
|
|
|
|
|
|
|
|
|
|
|
|
|
||
4 |
RESERVOIR |
|
Ralph D. Bollman |
|
|
|
|
|
|
|
|
||
|
|
|
|
WTP |
|
|
|
|
|
|
|
|
|
|
|
|
|
4 |
|
|
|
|
|
|
|
|
|
|
|
|
|
|
|
|
|
|
|
|
|
|
|
|
|
|
|
|
242 |
|
|
|
|
|
|
|
|
|
|
|
|
|
District |
|
|
|
|
|
|
|
|
|
|
|
Pacheco |
|
Center |
|
|
|
|
|
|
|
|
|
MARTINEZ |
|
|
|
|
|
|
|
|
|
|
||
|
|
|
|
|
|
|
|
|
|
|
|
|
|
|
|
|
|
|
Concord |
|
|
CCWD |
|
|
|
||
|
|
|
|
|
|
||||||||
|
|
|
|
|
|
TREATED WATER |
|
||||||
|
|
|
|
|
|
|
|
|
|||||
|
|
|
|
Pleasant |
|
SERVICE AREA |
|||||||
|
|
|
|
|
|
||||||||
|
|
|
|
Hill |
|
|
|
|
|
|
|
|
|
|
|
|
|
680 |
|
|
|
|
|
|
|
Clayton |
|
Walnut Creek
24
680
Contra Costa Water District Boundary
Contra Costa Canal
Los Vaqueros Pipeline
Shortcut Pipeline
SA |
|
|
|
|
|
|
|
|
C |
|
|
|
R |
|
|
|
|
R |
A |
|
|
|
|
|
|
|
|
|
ME |
V |
|
|
|
|
|
|
|
|
NT O RI |
|
|
|
|
|
|
|
|
|
160 |
|
|
|
|
|
|
|
|
|
|
|
R |
|
|
|
|
|
|
|
E |
THE |
|
|
|
|
|
|
|
IN |
|
|
|
|
|
|
|
|
IV |
|
|
|
|
|
|
|
|
R |
|
|
|
|
|
|
|
U |
|
|
|
|
|
|
|
AQ |
|
|
|
|
|
|
|
|
SA N JO |
|
|
|
|
PITTSBURG
160 DIABLO
4WATER DISTRICT
|
|
|
|
Oakley |
|
ANTIOCH |
|
||
|
|
|
||
|
|
|
|
WTP |
CONTRA |
|
|
|
CCWD/ |
ANTIOCH |
|
City of Brentwood |
||
LOMA |
|
|||
RESERVOIR |
RESERVOIR |
4 |
WTP |
|
|
||||
|
|
|
Intertie |
|
|
|
BRENTWOOD |
|
|
|
|
|
4 |
|
|
|
CCWD |
|
Transfer |
|
|
|
Facility |
LOS
VAQUEROS
RESERVOIR
DELTA
ROCK
SLOUGH
INTAKE
Discovery
Bay
4
OLD RIVER |
MIDDLE |
INTAKE |
RIVER |
|
INTAKE |
J4CLIFTON
COURT
FOREBAY
4 2020 ANNUAL WATER QUALITY REPORT

YOUR WATER IS SAFE AND RELIABLE
INVESTMENTS IN
INFRASTRUCTURE
We’ve recently replaced the concrete liner along several sections of the
In addition to ensuring safe, clean water at your
tap, it’s our responsibility to maintain and upgrade the facilities that move the water throughout our communities. Every year, we invest in infrastructure upgrades like pipeline replacement, Contra Costa Canal rehabilitation, storage tank improvements, and much more to avoid costly and disruptive breaks in our system.
To learn more about planned capital improvements, visit ccwater.com/
ArchiveCenter/ViewFile/Item/323
THE FACTS ABOUT PFAS
chemicals that includes perfluorooctanoic acid (PFOA), perfluorooctanesulfonic acid (PFOS) and GenX chemicals. Since the 1940s, PFAS have been manufactured and used in a variety
of industries around the globe, including in the United States. The chemicals have been used in consumer products such as carpets, clothing, fabrics for furniture, paper packaging for food, and other materials (e.g., cookware) designed to be waterproof,
Testing has confirmed that CCWD’s water supply is safe to drink and PFOA/PFOS were not detected during monitoring.
To learn more about PFAS and drinking water, visit ccwater.com/422.
SAFE FROM COVID-19
Existing filtration and disinfection processes in our water treatment systems remove and kill viruses including the coronavirus. While water quality was unaffected by this new virus in our community, operations were adjusted to ensure the skilled workforce that treats, operates, and maintains remained healthy and able to keep your public water system functioning.
Coronavirus does not pose a threat to the water you depend on for drinking, bathing, washing, and so much more.
Additional information about coronavirus and drinking water is available at
2020 ANNUAL WATER QUALITY REPORT 5

DEFINITIONS & ABBREVIATIONS
Action Level (AL) – The concentration of a contaminant which, if exceeded, triggers treatment or other requirements which a water system must follow
Maximum Contaminant Level (MCL) – The highest level of a contaminant that is allowed in drinking water. Primary MCLs are set as close to the PHGs (or MCLGs) as is economically or technologically feasible
Maximum Contaminant Level Goal (MCLG) – The level of a contaminant in drinking water below which there is no known or expected risk to health. MCLGs are set by the U.S. Environmental Protection Agency
Maximum Residual Disinfectant Level (MRDL) –
The highest level of a disinfectant allowed in drinking water. There is convincing evidence that the addition of a disinfectant is necessary for control of microbial contaminants
Maximum Residual Disinfectant Level Goal (MRDLG) – The level of a drinking water disinfectant below which there is no known or expected risk to health. MRDLGs do not reflect the benefits of the use of disinfectants to control microbial contaminants
mg/L – Milligrams per liter
n/a – Not analyzed or not applicable (when used in average column, only one data point is available)
ND – Not detected at or above the reporting level ng/L – Nanograms per liter
NTU – Nephelometric turbidity units
Primary Drinking Water Standards – MCLs and MRDLs for contaminants that affect health along with their monitoring and reporting requirements, and water treatment requirements
pCi/L – Picocuries per liter (a measure of radioactivity)
Public Health Goal (PHG) – The level of a contaminant in drinking water below which there is no known or expected risk to health. PHGs are set by the California Environmental Protection Agency Office of Health and Hazard Assessment
RAA – Running Annual Average
Secondary Drinking Water Standards – Secondary MCLs are set for contaminants that affect the odor, taste or appearance of water
Treatment Technique (TT) – A required process intended to reduce the level of a contaminant in drinking water
µg/L – Micrograms per liter
µmhos/cm– micromhos per centimeter (a measure of conductivity)
HOW TO READ THE TABLES
The following tables contain detailed information about the water that is delivered to your home or business. Your water is regularly tested for more than 120 chemicals and substances, as well as radioactivity. Only those constituents that were detected in 2020 are listed in the tables.
Constituents may vary from provider to provider depending on water source and treatment techniques. Please see ccwater.com for a list of constituents tested but not detected.
WATER
PROVIDER
PRIMARY DRINKING WATER STANDARDS Contaminants that may affect health
|
State |
Highest |
Range |
|
|
4 |
|
Inorganic |
or |
Average |
Major Source in Drinking Water |
||||
Amount |
|||||||
Federal |
Detected |
||||||
|
Allowed |
|
|
||||
|
Goal |
|
|
|
|
|
|
|
1 |
2 |
|
3 |
Erosion of natural deposits; water |
||
|
|
|
|
|
|||
Fluoride (mg/L) |
1 |
2 |
0.8 |
additive that promotes strong |
|
||
teeth; discharge from fertilizer and |
|||||||
|
|
|
|
|
|||
|
|
|
|
|
aluminum factories |
|
|
|
|
|
|
|
|
|
|
- State or Federal Goal (PHG, MCLG or MRDLG) – The level of contaminant in drinking water below which there is no known or expected risk to health
- Highest Amount Allowed (AL, MCL or MRDL) – The highest level of a contaminant that is allowed in drinking water
- Average – The average level of a detected contaminant in drinking water
- Major Source in Drinking Water – The most likely way a contaminant enters drinking water
UNITS |
EQUIVALENCE |
|
|
|
|
mg/L (milligrams per liter) |
1 second in 11.5 days |
|
ppm (parts per million) |
||
|
||
|
|
|
µg/L (micrograms per liter) |
1 second in nearly 32 years |
|
ppb (parts per billion) |
||
|
||
|
|
6 2020 ANNUAL WATER QUALITY REPORT
CONTRA COSTA WATER DISTRICT
TABLE OF CHEMICALS OR CONSTITUENTS DETECTED IN WATER IN 2020
|
|
|
CCWD |
CCWD- |
|
|||||
|
|
|
WTP* |
BRENTWOOD WTP |
|
|||||
|
|
|
|
|
|
|||||
PRIMARY DRINKING WATER STANDARDS |
Contaminants that may affect health |
|
|
|
||||||
Inorganic |
State or |
Highest Amt. |
Range |
Average |
Range |
Average |
Range |
Average |
Major Source in Drinking Water |
|
Federal Goal |
Allowed |
Detected |
Detected |
Detected |
||||||
Fluoride (mg/L) |
1 |
2 |
0.7 |
0.7 |
ND |
Erosion of natural deposits; water additive that promotes |
||||
strong teeth |
||||||||||
|
|
|
|
|
|
|
|
|
||
Nitrate as N (mg/L) |
10 |
10 |
0.1 |
0.4 |
0.1 |
Runoff and leaching from fertilizer use |
||||
Lead and Copper |
State or |
Highest Amt. |
# of Sites |
90% |
# of Sites |
90% |
# of Sites |
90% |
|
|
Tested/# |
Tested/# |
Tested/# |
Major Source in Drinking Water |
|||||||
Federal Goal |
Allowed |
Percentile |
Percentile |
Percentile |
||||||
|
Exceeding AL |
Exceeding AL |
Exceeding AL |
|
||||||
|
|
|
|
|
|
|
||||
Lead (µg/L) |
0.2 |
15 |
55/0 |
ND |
n/a |
n/a |
n/a |
n/a |
Internal corrosion of household water plumbing systems; discharges |
|
from industrial manufacturers; erosion of natural deposits |
||||||||||
|
|
|
|
|
|
|
|
|
||
Copper (mg/L) |
0.3 |
1.3 |
55/0 |
0.14 |
n/a |
n/a |
n/a |
n/a |
Internal corrosion of household water plumbing systems; |
|
erosion of natural deposits; leaching from wood preservatives |
||||||||||
|
|
|
|
|
|
|
|
|
||
Date of sampling |
|
|
June 2019 |
n/a |
n/a |
|
||||
Microbiological |
State or |
Highest Amt. |
Maximum |
Average or |
Maximum |
Average or |
Maximum |
Average or |
|
|
[Monthly % of |
[Monthly % of |
[Monthly % of |
Major Source in Drinking Water |
|||||||
Standards |
Federal Goal |
Allowed |
Value |
Samples that Meets |
Value |
Samples that Meets |
Value |
Samples that Meets |
||
|
|
|
|
Requirement] |
|
Requirement] |
|
Requirement] |
|
|
Total Coliform |
n/a |
5% of mo. |
0.3% |
n/a |
n/a |
n/a |
n/a |
Naturally present in the environment |
||
(state Total Coliform Rule) |
|
samples |
|
|
|
|
|
|
|
|
Turbidity (NTU) |
n/a |
95% ≤ 0.3 |
0.22 |
[100%] |
0.10 |
[100%] |
0.14 |
[100%] |
Soil runoff |
|
(treatment plant) |
||||||||||
|
|
|
|
|
|
|
|
|
||
Disinfectant/Disin- |
State or |
Highest Amt. |
Range |
Highest |
Range |
Highest |
Range |
Highest |
|
|
Quarterly |
Quarterly |
Quarterly |
Major Source in Drinking Water |
|||||||
fection Byproducts |
Federal Goal |
Allowed |
Detected |
Detected |
Detected |
|||||
RAA |
RAA |
RAA |
|
|||||||
Bromate (µg/L) |
0.1 |
10 |
ND |
n/a |
n/a |
n/a |
n/a |
Disinfectant/Disinfection Byproducts |
||
Chloramines as CI2 (mg/L) |
|
4 |
1.7 |
n/a |
n/a |
n/a |
n/a |
Disinfectant/Disinfection Byproducts |
||
Haloacetic acids (µg/L) |
n/a |
60 |
12 |
n/a |
n/a |
n/a |
n/a |
Byproduct of drinking water disinfection |
||
Total trihalomethanes |
n/a |
80 |
20 |
n/a |
n/a |
n/a |
n/a |
Byproduct of drinking water disinfection |
||
(µg/L) |
||||||||||
|
|
|
|
|
|
|
|
|
||
SECONDARY DRINKING WATER STANDARDS Contaminants that may affect the odor, taste or appearance of water |
||||||||||
|
State or |
Highest Amt. |
Range |
Average |
Range |
Average |
Range |
Average |
Major Source in Drinking Water |
|
|
Federal Goal |
Allowed |
Detected |
Detected |
Detected |
|||||
|
|
|
|
|
||||||
Chloride (mg/L) |
n/a |
250 |
58 |
58 |
68 |
Runoff/leaching from natural deposits; seawater influence |
||||
Specific conductivity |
n/a |
900 |
437 |
466 |
473 |
Substances that form ions when in water; seawater influence |
||||
(µmhos/cm) |
||||||||||
|
|
|
|
|
|
|
|
|
||
Sulfate (mg/L) |
n/a |
250 |
49 |
62 |
54 |
|||||
Total dissolved solids |
n/a |
500 |
231 |
248 |
252 |
Runoff/leaching from natural deposits |
||||
(mg/L) |
||||||||||
|
|
|
|
|
|
|
|
|
||
Turbidity (NTU) |
n/a |
5 |
0.20 |
n/a |
n/a |
n/a |
n/a |
Soil runoff |
||
(distribution system) |
||||||||||
|
|
|
|
|
|
|
|
|
||
GENERAL WATER QUALITY PARAMETERS |
|
|||||||||
|
State or |
Highest Amt. |
Range |
Average |
Range |
Average |
Range |
Average |
PUBLIC MEETINGS |
|
|
Federal Goal |
Allowed |
Detected |
Detected |
Detected |
|||||
|
|
|||||||||
|
|
|
|
|
||||||
Alkalinity (mg/L) |
n/a |
n/a |
69 |
65 |
66 |
First and Third Wednesday |
||||
Ammonia (mg/L) |
n/a |
n/a |
0.6 |
n/a |
0.5 |
n/a |
0.5 |
n/a |
||
6:30 p.m. |
||||||||||
Bromide (mg/L) |
n/a |
n/a |
0.1 |
0.1 |
0.1 |
|||||
Calcium (mg/L) |
n/a |
n/a |
16 |
17 |
16 |
1331 Concord Avenue |
||||
Hardness (mg/L) |
n/a |
n/a |
85 |
89 |
88 |
Concord, CA 94520 |
||||
Magnesium (mg/L) |
n/a |
n/a |
11 |
11 |
12 |
|||||
pH |
n/a |
n/a |
8.4 |
8.2 |
8.4 |
|||||
|
|
|
|
|
|
|
|
|
ccwater.com |
|
Potassium (mg/L) |
n/a |
n/a |
2.5 |
2.5 |
2.6 |
|||||
Sodium (mg/L) |
n/a |
n/a |
52 |
55 |
58 |
|
||||
UCMR4 ASSESSMENT MONITORING |
|
|
|
|
|
|||||
|
Federal Goal |
Level |
Detected |
Average |
Detected |
Average |
Detected |
Average |
to |
|
|
State or |
Notification |
Range |
|
Range |
|
Range |
|
|
|
|
|
|
|
|
|
|
|
|
teleconference information, visit |
|
Manganese (µg/L) |
n/a |
500 |
3.6 |
12 |
3.2 |
|||||
HAA5 (µg/L) |
n/a |
n/a |
6.6 |
n/a |
n/a |
n/a |
n/a |
ccwater.com. |
||
HAA Br (µg/L) |
n/a |
n/a |
7.1 |
n/a |
n/a |
n/a |
n/a |
|
||
HAA9 (µg/L) |
n/a |
n/a |
11 |
n/a |
n/a |
n/a |
n/a |
If you have any questions about Contra |
||
Total Organic Carbon |
n/a |
n/a |
2,800– |
3,475 |
2,000– |
3000 |
2,100– |
3,525 |
||
Costa Water District tap water, please |
||||||||||
(TOC) (µg/L) |
4,200 |
4,300 |
5400 |
|||||||
|
|
|
|
|
|
|
|
|
call |
|
Bromide (µg/L) |
n/a |
n/a |
189 |
191 |
176 |
|||||
|
|
|||||||||
2020 ANNUAL WATER QUALITY REPORT 7
CITY OF ANTIOCH
SOURCE OF WATER
The City of Antioch purchases untreated water from CCWD, treats it in
a
TABLE OF CHEMICALS OR CONSTITUENTS DETECTED IN WATER IN 2020
CITY OF
ANTIOCH
PRIMARY DRINKING WATER STANDARDS Contaminants that may affect health
plant and delivers it to customers through the City’s distribution pipes. The City is also able to pump directly from the San Joaquin River or purchase treated water from CCWD.
The City completes watershed sanitary surveys every five years. The last survey, completed in 2018, concluded that potential contamination is regularly mitigated by the natural flushing of the Delta, controls at contamination
Inorganic
Fluoride (mg/L)
Lead and Copper
Lead (µg/L)
Copper (mg/L)
Date of sampling
Microbiological Standards
Turbidity (NTU) (treatment plant)
Disinfectant/Disinfection Byproducts
Chloramines as CI2 (mg/L)
Haloacetic acids (µg/L)
Total trihalomethanes (µg/L)
State or
Federal Goal
1
State or
Federal Goal
0.2
0.3
State or
Federal Goal
n/a
State or
Federal Goal
n/a
n/a
Highest Amt. |
Range |
Average |
Major Source in Drinking Water |
|
Allowed |
Detected |
|||
|
|
4 |
0.8 |
Erosion of natural deposits; water additive that |
|||
promotes strong teeth |
|||||
|
|
|
|
||
Highest Amt. |
# of Sites |
90% |
|
||
Tested/# |
Major Source in Drinking Water |
||||
Allowed |
|
Percentile |
|||
Exceeding AL |
|
|
|||
|
|
|
|
||
|
|
|
|
Internal corrosion of household water plumbing |
|
0 |
50/0 |
< 5.0 |
systems; discharges from industrial manufacturers; |
||
|
|
|
|
erosion of natural deposits |
|
|
|
|
|
Internal corrosion of household water plumbing |
|
1.3 |
50/0 |
0.051 |
systems; erosion of natural deposits; leaching from |
||
|
|
|
|
wood preservatives |
|
|
August 2018 |
|
|||
Highest Amt. |
Maximum |
|
Monthly % |
|
|
|
|
||||
|
of Samples |
Major Source in Drinking Water |
|||
Allowed |
Value |
|
that Meets |
||
|
|
||||
|
|
|
Requirement |
|
|
95% ≤ 0.3 |
0.19 |
|
99% |
Soil runoff |
|
Highest Amt. |
Range |
|
Highest |
Major Source in Drinking Water |
|
Allowed |
Detected |
|
Quarterly RAA |
||
4 |
|
2.4 |
Drinking water disinfectant added for treatment |
||
60 |
|
8.0 |
Byproduct of drinking water disinfection |
||
80 |
|
55 |
Byproduct of drinking water disinfection |
||
|
|
|
|
|
|
sources and existing water
SECONDARY DRINKING WATER STANDARDS Contaminants that may affect the odor, taste or appearance of water
treatment practices.
In April 2003, Antioch conducted a source water assessment. In summary:
• Antioch Municipal |
Reservoir was found |
to be most vulnerable |
to sewer collection |
Chloride (mg/L)
Specific conductivity (µmhos/cm)
Sulfate (mg/L)
Total dissolved solids (mg/L)
Turbidity (NTU)
(distribution system)
State or
Federal Goal
n/a
n/a
n/a
n/a
n/a
n/a
Highest Amt.
Allowed
n/a
3
900
250
500
5
Range
Detected
Average
70
2
490
53
294
0.06
Major Source in Drinking Water
Runoff/leaching from natural deposits; seawater influence
Substances that form ions when in water; seawater influence
Runoff/leaching from natural deposits
Soil runoff
systems; this activity |
GENERAL WATER QUALITY PARAMETERS
is not associated with |
contaminants in the |
water supply. |
• San Joaquin River |
was found to be most |
vulnerable to the effects |
of saltwater intrusion, |
Alkalinity (mg/L)
Calcium (mg/L)
Hardness (mg/L)
Magnesium (mg/L)
pH
Potassium (mg/L)
Sodium (mg/L)
State or
Federal Goal
n/a
n/a
n/a
n/a
n/a
n/a
n/a
Highest Amt.
Allowed
n/a
n/a
n/a
n/a
n/a
n/a
n/a
Range
Detected
Average
80
18
94
12
8.6
2.5
59
PUBLIC MEETINGS
Second and Fourth Tuesdays 7:00 p.m.
200 H Street Antioch, CA 94509
chemical/petroleum |
UCMR4 ASSESSMENT MONITORING
processing or storage, |
and regulated point |
discharges. |
Water from the San Joaquin River is not always acceptable due to saltwater intrusion. When chloride levels in the river exceed 250 milligrams per liter, the City stops pumping until chloride levels decrease.
Manganese (µg/L)
HAA5 (µg/L)
HAA Br (µg/L)
HAA9 (µg/L)
Total Organic Carbon (TOC) (µg/L)
Bromide (µg/L)
State or
Federal Goal
n/a
n/a
n/a
n/a
n/a
n/a
Notification
Level
500
n/a
n/a
n/a
n/a
n/a
Range
Detected
2,500–
3,900
Average
3.6
4.8
5.2
8.9
3,200
238
If you have any questions about the City of Antioch tap water, please call
8 2020 ANNUAL WATER QUALITY REPORT
CITY OF MARTINEZ
TABLE OF CHEMICALS OR CONSTITUENTS DETECTED IN WATER IN 2020
CITY OF
MARTINEZ
PRIMARY DRINKING WATER STANDARDS Contaminants that may affect health
SOURCE OF WATER
The City of Martinez purchases untreated water from CCWD, treats it in a
Inorganic
Fluoride (mg/L)
Nitrate as N (mg/L)
Lead and Copper
Lead (µg/L)
Copper (mg/L)
Date of sampling
Microbiological Standards
Turbidity (NTU) (treatment plant)
Disinfectant/Disinfection Byproducts
Chloramines as CI2 (mg/L)
Haloacetic acids (µg/L)
Total trihalomethanes (µg/L)
State or
Federal Goal
1
10
State or
Federal Goal
0.2
0.3
State or
Federal Goal
n/a
State or
Federal Goal
n/a
n/a
Highest Amt.
Allowed
2
10
Highest Amt.
Allowed
15
1.3
Highest Amt.
Allowed
95% ≤ 0.3
Highest Amt.
Allowed
4
60
80
Range |
Average |
Major Source in Drinking Water |
|
Detected |
|||
|
|
0.7 |
Erosion of natural deposits; water additive that |
||
promotes strong teeth |
|||
|
|
||
0.3 |
Runoff and leaching from fertilizer use |
||
# of Sites |
90% |
|
|
Tested/# |
Major Source in Drinking Water |
||
Percentile |
|||
Exceeding AL |
|
||
|
|
||
|
|
Internal corrosion of household water plumbing |
|
61/0 |
ND |
systems; discharges from industrial manufacturers; |
|
|
|
erosion of natural deposits |
|
|
|
Internal corrosion of household water plumbing |
|
61/0 |
0.07 |
systems; erosion of natural deposits; leaching from |
|
|
|
wood preservatives |
|
June 2018 |
|
||
Maximum |
Average or |
|
|
[Monthly % of |
Major Source in Drinking Water |
||
Value |
Samples that Meets |
||
|
Requirement] |
|
|
0.11 |
[100%] |
Soil runoff |
|
Range |
Highest |
Major Source in Drinking Water |
|
Detected |
Quarterly RAA |
||
1.7 |
Drinking water disinfectant added for treatment |
||
3.0 |
Byproduct of drinking water disinfection |
||
16 |
Byproduct of drinking water disinfection |
||
|
|
|
|
treatment plant and delivers it through the City’s distribution pipes to customers who are not served treated water directly from CCWD.
SECONDARY DRINKING WATER STANDARDS Contaminants that may affect the odor, taste or appearance of water
Chloride (mg/L)
Specific conductivity (µmhos/cm)
Sulfate (mg/L)
Total dissolved solids (mg/L)
Turbidity (NTU)
(distribution system)
State or
Federal Goal
n/a
n/a
n/a
n/a
n/a
n/a
Highest Amt.
Allowed
250
3
900
250
500
5
Range
Detected
Average
57
1
425
50
240
0.3
Major Source in Drinking Water
Runoff/leaching from natural deposits; seawater influence
Substances that form ions when in water; seawater influence
Runoff/leaching from natural deposits
Soil runoff
GENERAL WATER QUALITY PARAMETERS
Alkalinity (mg/L)
Bromide (mg/L)
Calcium (mg/L)
Hardness (mg/L) Magnesium (mg/L) pH
Potassium (mg/L) Sodium (mg/L)
State or
Federal Goal
n/a
n/a
n/a
n/a
n/a
n/a
n/a
n/a
Highest Amt.
Allowed
n/a
n/a
n/a
n/a
n/a
n/a
n/a
n/a
Range
Detected
Average
64
0.2
15
79
10
9.0
2.5
51
PUBLIC MEETINGS
First and Third Wednesdays 7:00 p.m.
525 Henrietta Street Martinez, CA 94553
UCMR4 ASSESSMENT MONITORING
If you have any questions about
Manganese (µg/L)
HAA5 (µg/L)
HAA Br (µg/L)
HAA9 (µg/L)
Total Organic Carbon (TOC) (µg/L)
Bromide (µg/L)
State or
Federal Goal
n/a
n/a
n/a
n/a
n/a
n/a
Notification
Level
500
n/a
n/a
n/a
n/a
n/a
Range
Detected
2,800–
4,400
Average
3.1
2.4
2.7
3.8
3,667
227
the City of Martinez tap water, please call
2020 ANNUAL WATER QUALITY REPORT 9
CITY OF PITTSBURG
SOURCE OF WATER
The City of Pittsburg purchases untreated water from CCWD, treats it in
a
A source water assessment was conducted for the Dover Well in September 2015, and for Bodega Well in July 2009. In summary:
- Bodega well was found to be most vulnerable to residential sewer collection systems, abandoned military installation (Camp Stoneman) and illegal activities (drug labs).
- Dover well was considered most vulnerable to sewer collection systems, transportation corridors, and storm drain discharge points. No contaminants associated with the identified potentially contaminating activities (PCA) have been detected in water samples from Dover well.
TABLE OF CHEMICALS OR CONSTITUENTS DETECTED IN WATER IN 2020
CITY OF
PITTSBURG
PRIMARY DRINKING WATER STANDARDS Contaminants that may affect health
Inorganic |
State or |
Highest Amt. |
Range |
Average |
Major Source in Drinking Water |
||
Federal Goal |
Allowed |
Detected |
|||||
Aluminum (mg/L) |
0.6 |
1 |
0.05 |
Erosion of natural deposits; residue from some |
|||
surface water treatment processes |
|||||||
|
|
|
|
|
|
||
|
|
|
|
|
|
|
|
|
|
|
|
|
|
|
|
Arsenic (µg/L) |
0.004 |
10 |
2.1 |
Erosion of natural deposits; runoff from orchards; |
|||
glass and electronics production wastes |
|||||||
|
|
|
|
|
|
||
Fluoride (mg/L) |
1 |
2 |
0.7 |
Erosion of natural deposits; water additive that |
|||
promotes strong teeth |
|||||||
|
|
|
|
|
|
||
Nitrate as N (mg/L) |
10 |
10 |
0.4 |
|
n/a |
Runoff and leaching from fertilizer use |
|
Lead and Copper |
State or |
Highest Amt. |
# of Sites |
90% |
|
||
Tested/# |
Major Source in Drinking Water |
||||||
Federal Goal |
Allowed |
Percentile |
|||||
|
Exceeding AL |
|
|||||
|
|
|
|
|
|||
|
|
|
|
|
|
Internal corrosion of household water plumbing |
|
Lead (µg/L) |
0.2 |
15 |
54/0 |
|
ND |
systems; discharges from industrial manufacturers; |
|
|
|
|
|
|
|
erosion of natural deposits |
|
|
|
|
|
|
|
Internal corrosion of household water plumbing |
|
Copper (mg/L) |
0.3 |
1.3 |
54/0 |
|
ND |
systems; erosion of natural deposits; leaching from |
|
|
|
|
|
|
|
wood preservatives |
|
Date of sampling |
|
|
August 2018 |
|
|||
|
State or |
Highest Amt. |
Maximum |
Monthly % |
|
||
Microbiological Standards |
of Samples |
Major Source in Drinking Water |
|||||
Federal Goal |
Allowed |
Value |
that Meets |
||||
|
|
|
|
|
Requirement |
|
|
Turbidity (NTU) (treatment plant) |
n/a |
95% ≤ 0.3 |
0.16 |
|
100% |
Soil runoff |
|
Disinfectant/Disinfection |
State or |
Highest Amt. |
Range |
Highest |
Major Source in Drinking Water |
||
Byproducts |
Federal Goal |
Allowed |
Detected |
Quarterly RAA |
|||
Chloramines as CI2 (mg/L) |
|
4 |
1.5 |
Drinking water disinfectant added for treatment |
|||
Chlorite (mg/L) |
0.05 |
1 |
0.3 |
|
|||
Haloacetic acids (µg/L) |
n/a |
60 |
10 |
Byproduct of drinking water disinfection |
|||
Total trihalomethanes (µg/L) |
n/a |
80 |
36 |
Byproduct of drinking water disinfection |
|||
SECONDARY DRINKING WATER STANDARDS |
Contaminants that may affect the odor, taste or appearance of water |
||||||
|
State or |
Highest Amt. |
Range |
Average |
Major Source in Drinking Water |
||
|
Federal Goal |
Allowed |
Detected |
||||
|
|
|
|||||
Aluminum (µg/L) |
n/a |
200 |
49 |
Erosion of natural deposits; residue from some |
|||
surface water treatment processes |
|||||||
|
|
|
|
|
|
||
Chloride (mg/L) |
n/a |
250 |
94 |
Runoff/leaching from natural deposits; seawater |
|||
influence |
|||||||
|
|
|
|
|
|
||
n/a |
3 |
1.3 |
|
1.3 |
|||
|
|
|
|
|
|
|
|
Specific conductivity |
n/a |
900 |
658 |
Substances that form ions when in water; seawater |
|||
(µmhos/cm) |
influence |
||||||
|
|
|
|
|
|||
Sulfate (mg/L) |
n/a |
250 |
74 |
||||
Total dissolved solids (mg/L) |
n/a |
500 |
377 |
Runoff/leaching from natural deposits |
|||
|
|
|
|
|
|
|
|
Turbidity (NTU) |
n/a |
5 |
0.12 |
Soil runoff |
|||
(distribution system) |
|||||||
|
|
|
|
|
|
||
GENERAL WATER QUALITY PARAMETERS |
|
|
|
|
|||
|
State or |
Highest Amt. |
Range |
Average |
PUBLIC MEETINGS |
||
|
Federal Goal |
Allowed |
Detected |
||||
|
|
||||||
Alkalinity (mg/L) |
n/a |
n/a |
106 |
First and Third Mondays |
|||
Ammonia (mg/L) |
n/a |
n/a |
1.2 |
|
n/a |
||
Calcium (mg/L) |
n/a |
n/a |
29 |
|
n/a |
7:00 p.m. |
|
Hardness (mg/L) |
n/a |
n/a |
157 |
65 Civic Avenue |
|||
Magnesium (mg/L) |
n/a |
n/a |
16 |
|
n/a |
Pittsburg, CA 94565 |
|
pH |
n/a |
n/a |
8.5 |
||||
Potassium (mg/L) |
n/a |
n/a |
2.8 |
|
n/a |
||
|
ci.pittsburg.ca.us |
||||||
Sodium (mg/L) |
n/a |
n/a |
56 |
|
n/a |
||
UCMR4 ASSESSMENT MONITORING |
|
|
|
If you have any questions about |
|||
|
State or |
Notification |
Range |
Average |
|||
|
Federal Goal |
Level |
Detected |
|
the City of Pittsburg tap water, |
||
Manganese (µg/L) |
n/a |
500 |
3.9 |
||||
please call |
|||||||
HAA5 (µg/L) |
n/a |
n/a |
5.4 |
||||
HAA Br (µg/L) |
n/a |
n/a |
8.4 |
|
|||
HAA9 (µg/L) |
n/a |
n/a |
12 |
|
|||
Total Organic Carbon (TOC) |
n/a |
n/a |
2,100– |
2,975 |
|
||
(µg/L) |
4,200 |
|
|
||||
|
|
|
|
|
|||
Bromide (µg/L) |
n/a |
n/a |
115 |
|
|||
UNTREATED WATER TEST RESULTS |
|
|
|
|
|
||
Radiochemistry |
State or |
Highest Amt. |
Range |
Average |
|
||
Federal Goal |
Allowed |
Detected |
|
||||
Gross Beta (pCi/L) |
0 |
50 |
5.0 |
|
|||
Uranium (pCi/L) |
0.43 |
20 |
1.3 |
|
|||
10 2020 ANNUAL WATER QUALITY REPORT
DIABLO WATER DISTRICT
TABLE OF CHEMICALS OR CONSTITUENTS DETECTED IN WATER IN 2020
|
|
|
DIABLO WD |
|
||||
|
|
|
WTP |
|
||||
|
|
|
|
|
|
|||
PRIMARY DRINKING WATER STANDARDS Contaminants that may affect health |
|
|||||||
Inorganic |
State or |
Highest Amt. |
Range |
Average |
Range |
|
Average |
Major Source in Drinking Water |
Federal Goal |
Allowed |
Detected |
Detected |
|
||||
|
|
|
|
|
|
|
|
Erosion of natural deposits; |
Fluoride (mg/L) |
1 |
2 |
0.7 |
|
0.7 |
water additive that promotes |
||
|
|
|
|
|
|
|
|
strong teeth |
Nitrate as N (mg/L) |
10 |
10 |
0.5 |
|
0.4 |
Runoff and leaching from |
||
|
fertilizer use |
|||||||
|
|
|
|
|
|
|
|
|
Lead and Copper |
State or |
Highest Amt. |
# of Sites |
90% |
# of Sites |
|
90% |
|
Tested/# |
Tested/# |
|
Major Source in Drinking Water |
|||||
Federal Goal |
Allowed |
Percentile |
|
Percentile |
||||
|
Exceeding AL |
Exceeding AL |
|
|||||
|
|
|
|
|
|
|||
|
|
|
|
|
|
|
|
Internal corrosion of household |
Lead (µg/L) |
0.2 |
15 |
30/0 |
0.6 |
n/a |
|
n/a |
water plumbing systems; discharges |
|
from industrial manufacturers; |
|||||||
|
|
|
|
|
|
|
|
|
|
|
|
|
|
|
|
|
erosion of natural deposits |
|
|
|
|
|
|
|
|
Internal corrosion of household |
Copper (mg/L) |
0.3 |
1.3 |
30/0 |
0.14 |
n/a |
|
n/a |
water plumbing systems; erosion |
|
of natural deposits; leaching |
|||||||
|
|
|
|
|
|
|
|
|
|
|
|
|
|
|
|
|
from wood preservatives |
Date of sampling |
|
|
June 2019 |
|
n/a |
|
||
|
|
|
|
|
|
|
|
|
Microbiological |
State or |
Highest Amt. |
Maximum |
Monthly % |
Maximum |
|
Monthly % |
|
of Samples |
|
of Samples |
Major Source in Drinking Water |
|||||
Standards |
Federal Goal |
Allowed |
Value |
that Meets |
Value |
|
that Meets |
|
|
|
|||||||
|
|
|
|
Requirement |
|
|
Requirement |
|
Turbidity (NTU) |
n/a |
95% ≤ 0.3 |
n/a |
n/a |
0.10 |
|
100% |
Soil runoff |
(treatment plant) |
|
|||||||
|
|
|
|
|
|
|
|
|
Total Coliform |
n/a |
5% of mo. |
0.1% |
n/a |
|
n/a |
Soil runoff |
|
(State Total Coliform Rule) |
samples |
|
||||||
|
|
|
|
|
|
|
||
Disinfectant/ |
State or |
Highest Amt. |
Range |
Highest |
Range |
|
Highest |
Major Source in Drinking Water |
Disinfection Byproducts |
Federal Goal |
Allowed |
Detected |
Quarterly RAA |
Detected |
|
Quarterly RAA |
|
Chloramines as CI2 |
|
4 |
2.4 |
n/a |
|
n/a |
Drinking water disinfectant |
|
(mg/L) |
|
|
|
|
|
|
|
added for treatment |
Haloacetic acids (µg/L) |
n/a |
60 |
7.0 |
n/a |
|
n/a |
Byproduct of drinking water |
|
|
disinfection |
|||||||
|
|
|
|
|
|
|
|
|
Total trihalomethanes |
n/a |
80 |
12 |
n/a |
|
n/a |
Byproduct of drinking water |
|
(µg/L) |
|
disinfection |
||||||
|
|
|
|
|
|
|
||
SECONDARY DRINKING WATER STANDARDS Contaminants that may affect the odor, taste or appearance of water
SOURCE OF WATER
Diablo Water District purchases untreated water from CCWD. Water is treated and blended with groundwater pumped from two wells. The treated water is then delivered
to customers through its distributions pipes.
A source water assessment was conducted for the Glen Park well in April 2005 and for Stonecreek well in March 2011. In summary:
- Both wells were found to be most vulnerable to historic waste dumps/ landfills and septic systems (high density, >1/acre). These activities are not associated with contaminants in the water supply.
Chloride (mg/L)
Manganese (µg/L) Specific conductivity (µmhos/cm)
Sulfate (mg/L)
Total dissolved solids (mg/L)
Turbidity (NTU)
(distribution system)
State or
Federal Goal
n/a
n/a
n/a
n/a
n/a
n/a
Highest Amt.
Allowed
250
50
900
250
500
5
Range
Detected
Average
67
28
549
73
296
0.25
Range
Detected
ND
n/a
Average
58
n/a
466
62
248
n/a
Major Source in Drinking Water
Runoff/leaching from natural deposits; seawater influence
Leaching from natural deposits
Substances that form ions when in water; seawater influence
Soil runoff
GENERAL WATER QUALITY PARAMETERS
Alkalinity (mg/L)
Ammonia (mg/L)
Bromide (mg/L)
Calcium (mg/L)
Hardness (mg/L) Magnesium (mg/L) pH
Potassium (mg/L) Sodium (mg/L)
State or
Federal Goal
n/a
n/a
n/a
n/a
n/a
n/a
n/a
n/a
n/a
Highest Amt.
Allowed
n/a
n/a
n/a
n/a
n/a
n/a
n/a
n/a
n/a
Range
Detected
0.6
Average
84
n/a
0.1
22
112
14
8.0
2.5
63
Range
Detected
0.5
Average
65
n/a
0.1
17
89
11
8.2
2.5
55
PUBLIC MEETINGS
Fourth Wednesday 6:30 p.m.
87 Carol Lane Oakley, CA 94561
UCMR4 ASSESSMENT MONITORING
If you have any
Manganese (µg/L)
HAA5 (µg/L)
HAA Br (µg/L)
HAA9 (µg/L)
Total Organic Carbon (TOC) (µg/L)
Bromide (µg/L)
State or
Federal Goal
n/a
n/a
n/a
n/a
n/a
n/a
Notification
Level
500
n/a
n/a
n/a
n/a
n/a
Range
Detected
2,000–
4,400
Average
19
5.1
6.1
8.6
3,275
185
Range
Detected
n/a
n/a
n/a
2,000–
4,300
Average
12
n/a
n/a
n/a
3,000
191
questions about Diablo Water District tap water, please call
UNTREATED WATER TEST RESULTS
Radiochemistry |
State or |
Highest Amt. |
Range |
|
Federal Goal |
Allowed |
Detected |
||
|
||||
Uranium (pCi/L) |
0.43 |
20 |
Average
2.0
Range
Detected
n/a
Average
n/a
2020 ANNUAL WATER QUALITY REPORT 11
This report contains important information about your drinking water. Have someone translate it for you, or speak with someone who understands it.
Su informe anual de la calidad del agua en español está disponible en línea
en ccwater.com/awqr_es. Este informe contiene información importante sobre su agua potable.
Mahalaga ang impormasyong ito. Mangyaring ipasalin ito.
WANT MORE INFORMATION?
Contra Costa Water District’s website contains valuable information about water issues. Visit ccwater.com to begin your research.
Contaminants
City of Antioch
EWG's drinking water quality report shows results of tests conducted by the water utility and provided to the Environmental Working Group by the California State Water Resources Control Board, as well as information from the U.S. EPA Enforcement and Compliance History database (ECHO). For the latest quarter assessed by the U.S. EPA (January 2019 - March 2019), tap water provided by this water utility was in compliance with federal health-based drinking water standards.
Utility details
- Serves: 103833
- Data available: 2012-2017
- Data Source: Surface water
- Total: 11
Contaminants That Exceed Guidelines
- Chromium (hexavalent)
- Total trihalomethanes (TTHMs)
Other Detected Contaminants
- Chlorate
- Dichloromethane (methylene chloride)
- Fluoride
- Haloacetic acids (HAA5)
- Molybdenum
- Nitrate
- Nitrate and nitrite
- Strontium
- Vanadium
Reminder
Always take extra precautions, the water may be safe to drink when it leaves the sewage treatment plant but it may pick up pollutants during its way to your tap. We advise that you ask locals or hotel staff about the water quality. Also, note that different cities have different water mineral contents.
Sources and Resources
Sources Cited
Additional Resources
If you live in Antioch, Tennessee then you have probably wondered if your tap water is safe. Your tap water should be safe for your family to drink. There are many chemicals in the tap water that could be harmful if consumed or inhaled. A few of these include chlorine, lead and aluminum.
According to a study published by the Environmental Working Group in 2020, it was determined that more than ten million Americans drink the tap water that is contaminated with such dangerous chemicals every day. In fact, the EPA has found these contaminants in all major drinking water systems including your own.
If you think that your tap water is safe then you probably do not want to take the time to research the chemical levels. If you use tap water for your home water filtering system then you need to look carefully at the labels. Some systems do offer a choice to filter out chemicals that are not good for your family''s health.
If your system only fil