Table of Contents
Can You Drink Tap Water in Springfield?
Yes, Springfield's tap water is generally considered safe to drink as Springfield has no active health based violations of the Safe Drinking Water Act (SDWA) that we are aware of. Other factors such as lead piping in a home, or low levels of pollutants on immunocompromised individuals, should also be considered, however. To find more recent info we might have, you can check out our boil water notice page, the city's water provider website, or Springfield's local Twitter account.
According the EPA’s ECHO database, from April 30, 2019 to June 30, 2022, Springfield's water utility, Springfield Water and Sewer Commission, had 7 health-based violations of the Safe Drinking Water Act. For more details on the violations, please see our violation history section below. The last violation for Springfield was resolved on March 31, 2021. This assessment is based on the Springfield Water and Sewer Commission water system, other water systems in the city may have different results.
While tap water that meets the EPA health guidelines generally won’t make you sick to your stomach, it can still contain regulated and unregulated contaminants present in trace amounts that could potentially cause health issues over the long-run. These trace contaminants may also impact immunocompromised and vulnerable individuals.
The EPA is reviewing if it’s current regulations around pollutant levels in tap water are strict enough, and the health dangers posed by unregulated pollutants, like PFAS.
Water Quality Report for Springfield Tap Water
The most recent publicly available numbers for measured contaminant levels in Springfield tap water are in its 2020 Water Quality Report. As you can see, there are levels which the EPA considers to be acceptable, but being below the maximum allowable level doesn’t necessarily mean the water is healthy.
Lead in tap water, for example, is currently allowed at up to 15ppb by the EPA, but it has set the ideal goal for lead at zero. This highlights how meeting EPA standards doesn’t necessarily mean local tap water is healthy.
EPA regulations continue to change as it evaluates the long term impacts of chemicals and updates drinking water acceptable levels. The rules around arsenic, as well as, lead and copper are currently being re-evaluated.
There are also a number of "emerging" contaminants that are not currently. For example, PFAS (Per- and polyfluoroalkyl substances), for which the EPA has issued a health advisory. PFAS are called "forever chemicals" since they tend not to break down in the environment or the human body and can accumulate over time.
We recommend looking at the contaminants present in Springfield's water quality reports, or getting your home's tap water tested to see if you should be filtering your water.
Springfield Tap Water Safe Drinking Water Act Violation History - Prior 10 Years
Below is a ten year history of violations for the water system named Springfield Water and Sewer Commission for Springfield in Massachusetts. For more details please see the "What do these Violations Mean?" section below.
From Jan. 1, 2021 to March 31, 2021, Springfield had 1 health-based Safe Drinking Water Act violation with the violation category being Maximum Contaminant Level Violation, more specifically, the violation code was Maximum Contaminant Level Violation, Average which falls into the Disinfectants and Disinfection Byproducts Rule rule code group, and the Stage 2 Disinfectants and Disinfection Byproducts Rule rule code family for the following contaminant code: Total Haloacetic Acids (HAA5).
From Oct. 1, 2020 to Dec. 31, 2020, Springfield had 1 health-based Safe Drinking Water Act violation with the violation category being Maximum Contaminant Level Violation, more specifically, the violation code was Maximum Contaminant Level Violation, Average which falls into the Disinfectants and Disinfection Byproducts Rule rule code group, and the Stage 2 Disinfectants and Disinfection Byproducts Rule rule code family for the following contaminant code: Total Haloacetic Acids (HAA5).
From July 1, 2020 to Sept. 30, 2020, Springfield had 1 health-based Safe Drinking Water Act violation with the violation category being Maximum Contaminant Level Violation, more specifically, the violation code was Maximum Contaminant Level Violation, Average which falls into the Disinfectants and Disinfection Byproducts Rule rule code group, and the Stage 2 Disinfectants and Disinfection Byproducts Rule rule code family for the following contaminant code: Total Haloacetic Acids (HAA5).
From April 1, 2020 to June 30, 2020, Springfield had 1 health-based Safe Drinking Water Act violation with the violation category being Maximum Contaminant Level Violation, more specifically, the violation code was Maximum Contaminant Level Violation, Average which falls into the Disinfectants and Disinfection Byproducts Rule rule code group, and the Stage 2 Disinfectants and Disinfection Byproducts Rule rule code family for the following contaminant code: Total Haloacetic Acids (HAA5).
From Jan. 1, 2020 to March 31, 2020, Springfield had 1 health-based Safe Drinking Water Act violation with the violation category being Maximum Contaminant Level Violation, more specifically, the violation code was Maximum Contaminant Level Violation, Average which falls into the Disinfectants and Disinfection Byproducts Rule rule code group, and the Stage 2 Disinfectants and Disinfection Byproducts Rule rule code family for the following contaminant code: Total Haloacetic Acids (HAA5).
From Oct. 1, 2019 to Dec. 31, 2019, Springfield had 1 health-based Safe Drinking Water Act violation with the violation category being Maximum Contaminant Level Violation, more specifically, the violation code was Maximum Contaminant Level Violation, Average which falls into the Disinfectants and Disinfection Byproducts Rule rule code group, and the Stage 2 Disinfectants and Disinfection Byproducts Rule rule code family for the following contaminant code: Total Haloacetic Acids (HAA5).
From July 1, 2019 to Sept. 30, 2019, Springfield had 1 health-based Safe Drinking Water Act violation with the violation category being Maximum Contaminant Level Violation, more specifically, the violation code was Maximum Contaminant Level Violation, Average which falls into the Disinfectants and Disinfection Byproducts Rule rule code group, and the Stage 2 Disinfectants and Disinfection Byproducts Rule rule code family for the following contaminant code: Total Haloacetic Acids (HAA5).
From April 1, 2019 to June 30, 2019, Springfield had 1 health-based Safe Drinking Water Act violation with the violation category being Maximum Contaminant Level Violation, more specifically, the violation code was Maximum Contaminant Level Violation, Average which falls into the Disinfectants and Disinfection Byproducts Rule rule code group, and the Stage 2 Disinfectants and Disinfection Byproducts Rule rule code family for the following contaminant code: Total Haloacetic Acids (HAA5).
From Jan. 1, 2019 to March 31, 2019, Springfield had 1 health-based Safe Drinking Water Act violation with the violation category being Maximum Contaminant Level Violation, more specifically, the violation code was Maximum Contaminant Level Violation, Average which falls into the Disinfectants and Disinfection Byproducts Rule rule code group, and the Stage 2 Disinfectants and Disinfection Byproducts Rule rule code family for the following contaminant code: Total Haloacetic Acids (HAA5).
From Oct. 1, 2018 to Dec. 31, 2018, Springfield had 1 health-based Safe Drinking Water Act violation with the violation category being Maximum Contaminant Level Violation, more specifically, the violation code was Maximum Contaminant Level Violation, Average which falls into the Disinfectants and Disinfection Byproducts Rule rule code group, and the Stage 2 Disinfectants and Disinfection Byproducts Rule rule code family for the following contaminant code: Total Haloacetic Acids (HAA5).
From Dec. 1, 2015 to Dec. 31, 2015, Springfield had 1 non-health based Safe Drinking Water Act violation with the violation category being Monitoring and Reporting, more specifically, the violation code was Monitoring, Turbidity (Enhanced SWTR) which falls into the Microbials rule code group, and the Surface Water Treatment Rules rule code family for the following contaminant code: Interim Enhanced Surface Water Treatment Rule.
For the compliance period beginning June 1, 2015, Springfield had 1 non-health based Safe Drinking Water Act violation with the violation category being Monitoring and Reporting, more specifically, the violation code was Follow-up Or Routine LCR Tap M/R which falls into the Chemicals rule code group, and the Lead and Copper Rule rule code family for the following contaminant code: Lead and Copper Rule.
Is there Lead in Springfield Water?
Based on the EPA’s ECHO Database, 90% of the samples taken from the Springfield water system, Springfield Water and Sewer Commission, between sample start date and sample end date, were at or below, 0.0 mg/L of lead in Springfield water. This is 0% of the 0.015 mg/L action level. This means 10% of the samples taken from Springfield contained more lead.
While Springfield water testing may have found 0.0 mg/L of lead in its water, that does not mean your water source has the same amount. The amount of lead in water in a city can vary greatly from neighborhood to neighborhood, or even building to building. Many buildings, particularly older ones, have lead pipes or service lines which can be a source of contamination. To find out if your home has lead, we recommend getting you water tested.
No amount of lead in water is healthy, only less dangerous. As lead accumulates in our bodies over time, even exposure to relatively small amounts can have negative health effects. For more information, please check out our Lead FAQ page.
Are there PFAS in Springfield Tap Water?
Currently, testing tap water for PFAS isn’t mandated on a national level. We do have a list of military bases where there have been suspected or confirmed leaks. There appears to be at least one military base - Westover Air Reserve Base - near Springfield with suspected leaks.
With many potential sources of PFAS in tap water across the US, the best information we currently have about which cities have PFAS in their water is this ewg map, which you can check to see if Springfield has been evaluated for yet.
Our stance is better safe than sorry, and that it makes sense to try to purify the tap water just in case.
Springfield SDWA Violation History Table - Prior 10 Years
| Compliance Period | Status | Health-Based? | Category Code | Code | Rule Code | Contaminant Code | Rule Group Code | Rule Family Code |
|---|---|---|---|---|---|---|---|---|
| 01/01/2021 - 03/31/2021 | Resolved | Yes | Maximum Contaminant Level Violation (MCL) | Maximum Contaminant Level Violation, Average (02) | Stage 2 Disinfectants and Disinfection Byproducts Rule (220) | Total Haloacetic Acids (HAA5) (2456) | Disinfectants and Disinfection Byproducts Rule (200) | Stage 2 Disinfectants and Disinfection Byproducts Rule (220) |
| 10/01/2020 - 12/31/2020 | Archived | Yes | Maximum Contaminant Level Violation (MCL) | Maximum Contaminant Level Violation, Average (02) | Stage 2 Disinfectants and Disinfection Byproducts Rule (220) | Total Haloacetic Acids (HAA5) (2456) | Disinfectants and Disinfection Byproducts Rule (200) | Stage 2 Disinfectants and Disinfection Byproducts Rule (220) |
| 07/01/2020 - 09/30/2020 | Archived | Yes | Maximum Contaminant Level Violation (MCL) | Maximum Contaminant Level Violation, Average (02) | Stage 2 Disinfectants and Disinfection Byproducts Rule (220) | Total Haloacetic Acids (HAA5) (2456) | Disinfectants and Disinfection Byproducts Rule (200) | Stage 2 Disinfectants and Disinfection Byproducts Rule (220) |
| 04/01/2020 - 06/30/2020 | Archived | Yes | Maximum Contaminant Level Violation (MCL) | Maximum Contaminant Level Violation, Average (02) | Stage 2 Disinfectants and Disinfection Byproducts Rule (220) | Total Haloacetic Acids (HAA5) (2456) | Disinfectants and Disinfection Byproducts Rule (200) | Stage 2 Disinfectants and Disinfection Byproducts Rule (220) |
| 01/01/2020 - 03/31/2020 | Archived | Yes | Maximum Contaminant Level Violation (MCL) | Maximum Contaminant Level Violation, Average (02) | Stage 2 Disinfectants and Disinfection Byproducts Rule (220) | Total Haloacetic Acids (HAA5) (2456) | Disinfectants and Disinfection Byproducts Rule (200) | Stage 2 Disinfectants and Disinfection Byproducts Rule (220) |
| 10/01/2019 - 12/31/2019 | Archived | Yes | Maximum Contaminant Level Violation (MCL) | Maximum Contaminant Level Violation, Average (02) | Stage 2 Disinfectants and Disinfection Byproducts Rule (220) | Total Haloacetic Acids (HAA5) (2456) | Disinfectants and Disinfection Byproducts Rule (200) | Stage 2 Disinfectants and Disinfection Byproducts Rule (220) |
| 07/01/2019 - 09/30/2019 | Archived | Yes | Maximum Contaminant Level Violation (MCL) | Maximum Contaminant Level Violation, Average (02) | Stage 2 Disinfectants and Disinfection Byproducts Rule (220) | Total Haloacetic Acids (HAA5) (2456) | Disinfectants and Disinfection Byproducts Rule (200) | Stage 2 Disinfectants and Disinfection Byproducts Rule (220) |
| 04/01/2019 - 06/30/2019 | Archived | Yes | Maximum Contaminant Level Violation (MCL) | Maximum Contaminant Level Violation, Average (02) | Stage 2 Disinfectants and Disinfection Byproducts Rule (220) | Total Haloacetic Acids (HAA5) (2456) | Disinfectants and Disinfection Byproducts Rule (200) | Stage 2 Disinfectants and Disinfection Byproducts Rule (220) |
| 01/01/2019 - 03/31/2019 | Archived | Yes | Maximum Contaminant Level Violation (MCL) | Maximum Contaminant Level Violation, Average (02) | Stage 2 Disinfectants and Disinfection Byproducts Rule (220) | Total Haloacetic Acids (HAA5) (2456) | Disinfectants and Disinfection Byproducts Rule (200) | Stage 2 Disinfectants and Disinfection Byproducts Rule (220) |
| 10/01/2018 - 12/31/2018 | Archived | Yes | Maximum Contaminant Level Violation (MCL) | Maximum Contaminant Level Violation, Average (02) | Stage 2 Disinfectants and Disinfection Byproducts Rule (220) | Total Haloacetic Acids (HAA5) (2456) | Disinfectants and Disinfection Byproducts Rule (200) | Stage 2 Disinfectants and Disinfection Byproducts Rule (220) |
| 12/01/2015 - 12/31/2015 | Resolved | No | Monitoring and Reporting (MR) | Monitoring, Turbidity (Enhanced SWTR) (38) | Long Term 1 Enhanced Surface Water Treatment Rule (122) | Interim Enhanced Surface Water Treatment Rule (0300) | Microbials (100) | Surface Water Treatment Rules (120) |
| 06/01/2015 - | Resolved | No | Monitoring and Reporting (MR) | Follow-up Or Routine LCR Tap M/R (52) | Lead and Copper Rule (350) | Lead and Copper Rule (5000) | Chemicals (300) | Lead and Copper Rule (350) |
What do these Violations Mean?
Safe Drinking Water Act Violations categories split into two groups, health based, and non-health based. Generally, health based violations are more serious, though non-health based violations can also be cause for concern.
Health Based Violations
- Maximum contaminant levels (MCLs) - maximum allowed contaminant level was exceeded.
- Maximum residual disinfectant levels (MRDLs) - maximum allowed disinfectant level was exceeded.
- Other violations (Other) - the exact required process to reduce the amounts of contaminants in drinking water was not followed.
Non-Health Based Violations
- Monitoring and reporting violations (MR, MON) - failure to conduct the required regular monitoring of drinking water quality, and/or to submit monitoring results on time.
- Public notice violations (Other) - failure to immediately alert consumers if there is a serious problem with their drinking water that may pose a risk to public health.
- Other violations (Other) - miscellaneous violations, such as failure to issue annual consumer confidence reports or maintain required records.
SDWA Table Key
| Field | Description |
|---|---|
| Compliance Period | Dates of the compliance period. |
| Status |
Current status of the violation.
|
| Health-Based? | Whether the violation is health based. |
| Category Code |
The category of violation that is reported.
|
| Code | A full description of violation codes can be accessed in the SDWA_REF_CODE_VALUES (CSV) table. |
| Contaminant Code | A code value that represents a contaminant for which a public water system has incurred a violation of a primary drinking water regulation. |
| Rule Code |
Code for a National Drinking Water rule.
|
| Rule Group Code |
Code that uniquely identifies a rule group.
|
| Rule Family Code |
Code for rule family.
|
For more clarification please visit the EPA's data dictionary.
Springfield Water - Frequently Asked Questions
| By Mail: | 250 M STREET EXTENSION AGAWAM, MA, 01001 |
Existing customers can login to their Springfield Water and Sewer Commission account to pay their Springfield water bill by clicking here.
If you want to pay your Springfield Water and Sewer Commission bill online and haven't made an account yet, you can create an account online. Please click here to create your account to pay your Springfield water bill.
If you don't want to make an account, or can't remember your account, you can make a one-time payment towards your Springfield water bill without creating an account using a one time payment portal with your account number and credit or debit card. Click here to make a one time payment.
Moving to a new house or apartment in Springfield means you will often need to put the water in your name with Springfield Water and Sewer Commission. In order to put the water in your name, please click the link to the start service form below. Start service requests for water bills typically take two business days.
Leaving your house or apartment in Springfield means you will likely need to take your name off of the water bill with Springfield Water and Sewer Commission. In order to take your name off the water bill, please click the link to the stop service form below. Stop service for water bills requests typically take two business days.

The estimated price of bottled water
$1.29 in USD (1.5-liter)
USER SUBMITTED RATINGS
- Drinking Water Pollution and Inaccessibility
- Water Pollution
- Drinking Water Quality and Accessibility
- Water Quality
The above data is comprised of subjective, user submitted opinions about the water quality and pollution in Springfield, measured on a scale from 0% (lowest) to 100% (highest).
Related FAQS
Springfield Water Quality Report (Consumer Confidence Report)
The EPA mandates that towns and cities consistently monitor and test their tap water. They must report their findings in an annual Consumer Confidence Report. Below is the most recent water quality report from Springfield's Water. If you would like to see the original version of the report, please click here.
|
|
N |
G |
F |
I |
|
|
|
|
|
|
I |
|
|
|
|
|
|
|
||
|
R |
|
|
|
|
E |
|
|
|
|
|
|
|
|
|
|
L |
|
|
||
S |
P |
|
|
|
|
|
|
|
||
|
|
|
|
|
|
D |
||||
W |
|
|
|
|
|
|
|
|
|
N |
|
|
|
|
|
|
|
|
|
|
O |
A |
|
|
|
|
|
|
|
I |
||
T |
|
|
|
|
|
|
IS |
S |
|
|
E |
|
|
|
|
|
|
|
|
||
R |
|
|
|
|
|
|
M |
|
|
|
|
A |
|
|
|
|
|
|
|
|
|
|
|
|
|
|
|
M |
|
|
||
|
N |
|
|
|
|
|
|
|
||
|
D |
S |
|
|
|
O |
|
|
|
|
|
|
EWER |
C |
|
|
|
|
|||
|
|
|
|
|
|
|
||||
|
|
|
|
|
|
|
|
|||
Annual
Drinking Water
Quality Report
for Calendar Year 2020
SPRINGFIELD WATER AND SEWER COMMISSION
2020 Board of Commissioners
Vanessa Otero, Chairwoman
Daniel Rodriguez, Commissioner
William E. Leonard, Commissioner
Joshua D. Schimmel,
Executive Director
(413)
The Board of Commissioners meets monthly. Please call
Contact Information
Public Information: (413)
Billing / Account Questions: (413)
Water Quality Concerns and Water/Sewer Emergencies (24/7): (413)
Water/Sewer Service, Repairs (24/7): (413)
The Springfield Water and Sewer Commission provides this report to meet federal and state Safe Drinking Water Act Requirements.
Message from the Executive Director
Dear Customer,
Water is essential to daily life and public health; we rely on it for staying hydrated, cooking, cleaning, handwashing, and more. From the source in Cobble Mountain Reservoir to the faucet in your home, the Springfield Water and Sewer Commission takes great pride in the stewardship of your water, and ensuring every drop is safe to use and drink.
Also essential is the Commission’s water workforce who operate and maintain the drinking water system 24/7/365. In 2020, the dedicated employees of the Commission continued to carry out these essential duties, while enhancing safety protocols amid the
As part of these essential responsibilities, the Commission conducts daily water quality monitoring, and collects water samples from throughout the distribution system each day. In 2020 Commission personnel analyzed approximately 52,000 water sample tests to ensure the water distributed to homes and businesses meets strict drinking water quality standards.
The Springfield Water and Sewer Commission is pleased to share with you the 2020 Water Quality Report. This report summarizes the water quality tests from the past year and provides information about the source of your drinking water, treatment, proactive filtration plant upgrades, and other useful information.
Please share this information with all the other people who drink this water, es- pecially those who may not have received this notice directly (for example, peo- ple in apartments, nursing homes, schools, and businesses). You can do this by posting this notice in a public place or distributing copies by hand or mail. This report is available online at www.waterandsewer.org/waterqualityreport.
Special Health Information
Some people may be more vulnerable to contaminants in drinking water than the general population.
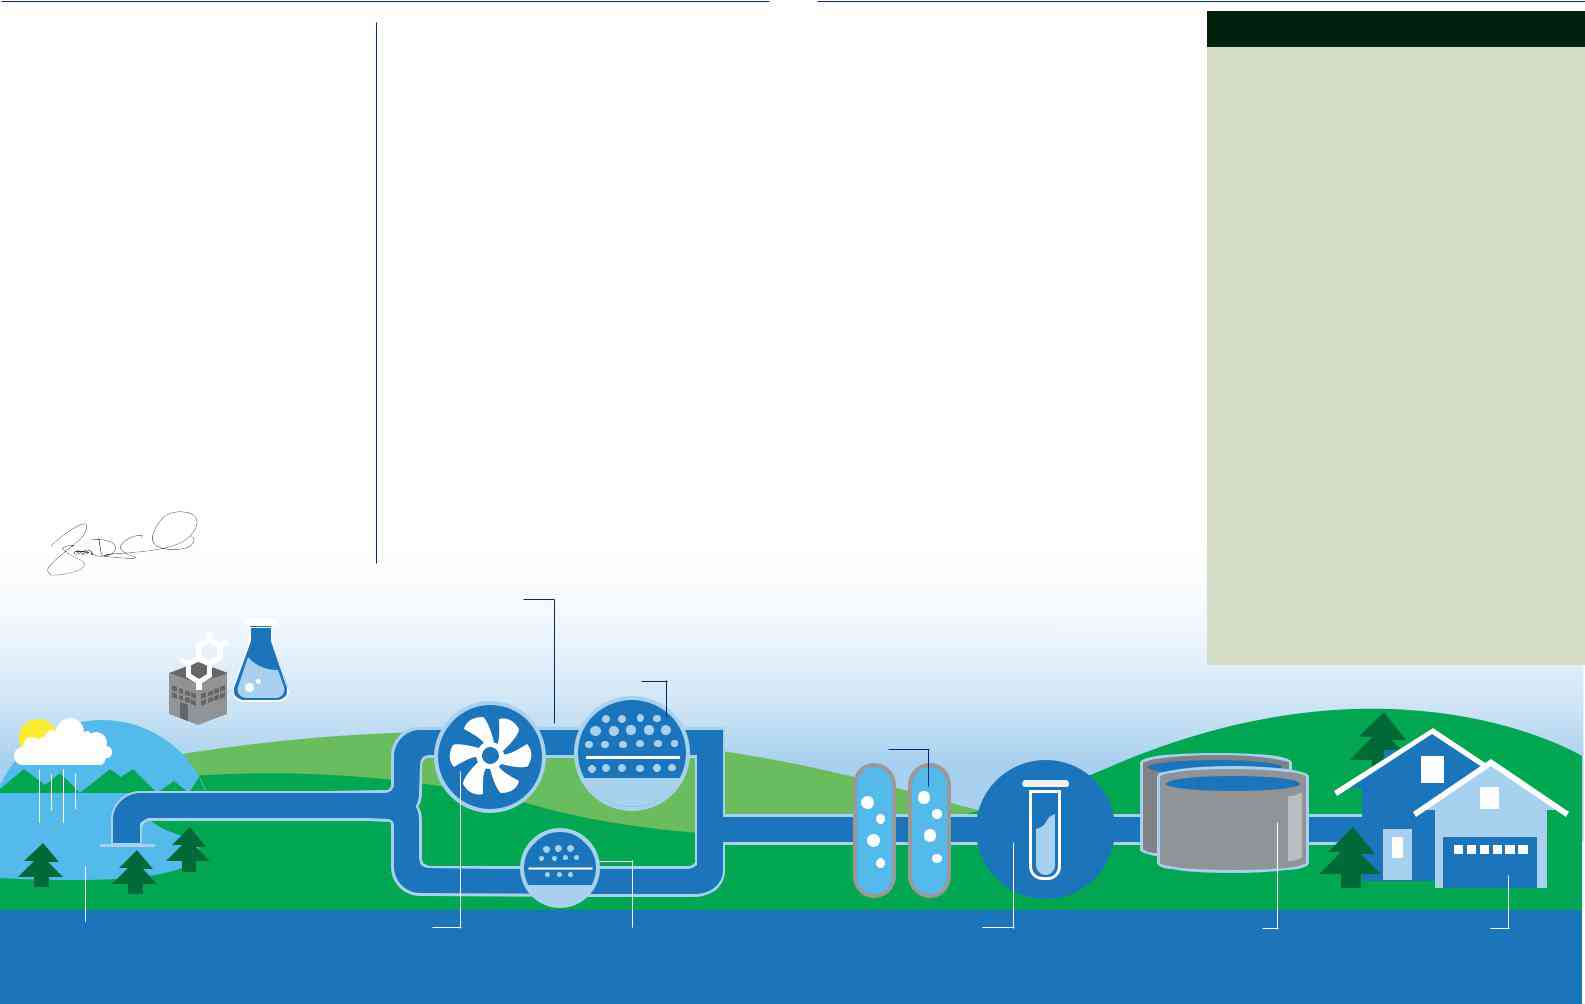
How We Treat Your Water
Water from Cobble Mountain Reservoir and Borden Brook Reservoir is filtered and treated at the West Parish Filters Water Treatment Plant in Westfield. After treatment, clean drinking water is delivered to retail customers in Springfield and Ludlow and wholesale customers in Agawam, East Longmeadow, and Longmeadow, at an annual average of 30 million gallons per day.
Protecting Your Water Source
Producing fresh, safe drinking water begins at the source. The Commis- sion actively protects and manages the watershed areas surrounding its reservoirs for the purpose of water supply protection. A healthy and resilient forest surrounding a water supply performs an important first step in the water treatment process and enhances water quality.
The Commission’s primary water supplies, Cobble Mountain Reser- voir (Source ID
Blandford and Granville, Massachusetts and surrounded by 14,000 acres of protected forestland within the Little River Watershed. The un- spoiled location and miles of protected land minimize the risk of water supply contamination, as the forest provides a natural buffer to sur- rounding development and natural filtration of potential contaminants.
The Commission is dedicated to protecting the environment and your drinking water source through an active Watershed Management Pro- gram. Active forest management includes monitoring for encroachment and potential sources of contamination; maintenance of watershed infra- structure, including roads and culverts; and other forest management activities to promote a healthy and resilient forest. While the majority of the land surrounding the reservoirs remains protected, the Commis- sion also maintains a land acquisition program to continue to enhance source protection and water quality.
These maintenance activities, watershed monitoring, and forest man- agement are guided by the Commission’s Watershed Protection Plan and Watershed Forest Vision, which provide a blueprint for source water protection and watershed management, to safeguard the drinking water supply, not only today, but well into the future.
The Massachusetts Department of Environmental Protection (MassDEP) completed a Source Water Assessment that evaluates the susceptibility of public water supplies to contamination from surrounding land uses. A susceptibility ranking of moderate was assigned to the Commission’s system using the information collected. Risks identified include residen- tial land use, transportation rights of way, and agriculture. The complete Source Water Assessment Program report is available by contacting the Commission at
Important Information from U.S. EPA and MassDEP
What could be in the water before it is treated?
Sources of drinking water (both tap water and bottled water) include rivers, lakes, streams, ponds, reservoirs, springs, and wells. As water travels over the surface of the land or through the ground, it dissolves
Microbial contaminants, such as viruses and bacteria, which may come from sewage treatment plants, septic systems, agricultural livestock operations, humans, and wildlife.
Inorganic contaminants, such as salts and metals, can be
Pesticides and herbicides may come from a variety of sources such as agriculture, urban storm water runoff, and residential uses.
Organic chemical contaminants include synthetic and volatile organic chemicals that are
Radioactive contaminants can be naturally occurring or be the result of oil and gas production, and mining activities.
Drinking water, including bottled water, may reasonably be expected to con- tain at least small amounts of some contamination. The presence of contaminants does not necessarily indicate that water poses a health risk. More information about contaminants and potential health effects can be obtained by calling the EPA’s Safe Drinking Water Hotline
In order to ensure that tap water is safe to drink, the Department of Environmental Protection (MassDEP) and U.S. Environmental Protection Agency (EPA) prescribe regulations that limit the amount of certain contaminants in
Joshua D. Schimmel
Executive Director
PLANNED NEW TREATMENT METHOD
A pilot study determined that Dissolved Air Flotation (DAF) was most effective in removing more dissolved natural organic matter (see page 6) from the raw water. Planning and design is underway to construct a DAF facility, which will become the second step in the treat- ment process.
RAPID SAND FILTRATION
Water exiting the coagulation and floccu- lation process enters granulated carbon filters to furthur remove dissolved natural organic matter.
CORROSION CONTROL
Phosphate is added to the water to protect pipes from leaching lead or copper, and sodium hydroxide is added to adjust pH.
water provided by public water systems. The Food and Drug Administration (FDA) and Massachusetts Department of Public Health (DPH) regulations establish limits for contaminants in bottled water that must provide the same protection for public health.
1
COBBLE MT. RESERVOIR
Raw water is drawn from the reservoir in Blandford/Granville and flows to the West Parish Filters Water Treatment Plant.
COAGULATION & FLOCCULATION
Most of the raw water is mixed with an additive in large tanks to cause solids and dissolved natural organic matter to bind together for removal.
SLOW SAND FILTRATION
A small amount of raw water moves directly to filtration in the slow sand filters to remove dissolved natural organic matter.
CHLORINATION
Chlorine is added to kill any
PROVIN MOUNTAIN STORAGE
The treated, chlorinated water is
DIRECT TO YOUR HOME
Water continues to flow by gravity from Provin Mountain through transmission mains to the distribution system for use by more than 250,000 customers in the lower Pioneer Valley.
2
2020 SWSC WATER QUALITY INFORMATION TABLE
The table below shows detections of regulated contaminants through |
Private certified laboratories were also utilized to analyze water |
|||||||||||||||||||||
water quality testing in 2020 (unless otherwise specified), and how they |
samples. The testing results are from finished water in the distribution |
|||||||||||||||||||||
compare to state and federal standards. The Commission’s state- |
|
|
system. In 2020, sample results for one regulated contaminant exceeded |
|||||||||||||||||||
certified laboratory analyzed approximately 52,000 water quality tests |
regulatory limits. Information about this exceedance is also contained in |
|||||||||||||||||||||
in 2020. |
|
|
|
|
|
|
|
|
|
|
this report. |
|
|
|
|
|
|
|
|
|
|
|
|
|
|
|
|
|
|
|
|
|
|
|
|
|
|
|
|||||||
|
|
|
|
|
|
PUBLIC WATER SUPPLY IDENTIFICATION #1281000 |
|
|
|
|
|
|
||||||||||
DISINFECTANTS |
DATE |
|
|
MRDLG |
|
|
MRDL |
|
|
HIGHEST |
RANGE DETECTED |
VIOLATION |
|
MAJOR SOURCES IN |
|
|||||||
|
|
|
|
QUARTERLY |
|
|
AT INDIVIDUAL |
|
|
|||||||||||||
|
|
|
|
|
|
|
DRINKING WATER |
|
||||||||||||||
|
|
|
|
|
|
|
|
|
|
ANNUAL AVERAGE |
|
SAMPLING SITES |
|
|
|
|
||||||
|
|
|
|
|
|
|
|
|
|
|
|
|
|
|
|
|
||||||
|
|
|
|
|
|
|
|
|
|
|
|
|
|
|
|
|
|
|
|
|
||
Residual Free Chlorine (ppm) |
Daily |
|
|
< 4.0 |
|
4.0 |
|
|
0.68 |
|
|
|
ND - 1.84 |
|
No |
Water additive used to |
|
|||||
|
|
|
|
|
|
|
|
|
control microbes |
|
||||||||||||
|
|
|
|
|
|
|
|
|
|
|
|
|
|
|
|
|
|
|
|
|||
BACTERIA |
DATE |
|
|
MCLG |
|
|
MCL |
|
|
HIGHEST |
RANGE DETECTED |
VIOLATION |
|
MAJOR SOURCES IN |
|
|||||||
|
|
|
|
|
|
|
|
AT INDIVIDUAL |
|
|
||||||||||||
|
|
|
|
DETECTED LEVEL |
|
|
|
DRINKING WATER |
|
|||||||||||||
|
|
|
|
|
|
|
|
|
|
|
SAMPLING SITES |
|
|
|
|
|||||||
|
|
|
|
|
|
|
|
|
|
|
|
|
|
|
|
|
|
|
|
|||
|
|
|
|
|
|
|
|
|
|
|
|
|
|
|
|
|
|
|
|
|
||
Heterotrophic Plate Counts |
|
|
|
|
|
|
|
|
|
|
|
|
|
|
|
|
|
HPC is an indicator method that |
|
|||
Daily |
|
|
N/A |
|
|
TT |
|
|
135 |
|
ND - 135 CFU/ml |
|
No |
measures a range of |
|
|||||||
(HPC)‡ |
|
|
|
|
|
|
|
|
naturally - occurring bacteria in |
|
||||||||||||
|
|
|
|
|
|
|
|
|
|
|
|
|
|
|
|
|
|
|||||
|
|
|
|
|
|
|
|
|
|
|
|
|
|
|
|
|
|
|
the environment. |
|
||
|
|
|
|
|
|
|
|
|
|
|
|
|
|
|
|
|
|
|
|
|||
INORGANICS |
DATE |
|
|
MCLG |
|
|
MCL |
|
|
HIGHEST |
RANGE DETECTED |
VIOLATION |
|
MAJOR SOURCES IN |
|
|||||||
|
|
|
|
|
|
|
|
AT INDIVIDUAL |
|
|
||||||||||||
|
|
|
|
DETECTED LEVEL |
|
|
|
DRINKING WATER |
|
|||||||||||||
|
|
|
|
|
|
|
|
|
|
|
SAMPLING SITES |
|
|
|
|
|||||||
|
|
|
|
|
|
|
|
|
|
|
|
|
|
|
|
|
|
|
|
|||
|
|
|
|
|
|
|
|
|
|
|
|
|
|
|
|
|
|
|
|
|
||
Nitrate (ppm) |
Yearly |
|
|
0 |
|
10 |
|
|
0.0698 |
|
|
|
N/A |
|
No |
Erosion of natural deposits, |
|
|||||
|
|
|
|
|
|
|
|
|
stormwater, fertilizer |
|
||||||||||||
|
|
|
|
|
|
|
|
|
|
|
|
|
|
|
|
|
|
|
|
|||
|
|
|
|
|
|
|
|
|
|
|
|
|
|
|
|
|
|
|||||
Barium (ppm) |
Yearly |
|
|
0 |
|
2 |
|
|
0.0074 |
|
|
|
N/A |
|
No |
Erosion of natural deposits |
|
|||||
|
|
|
|
|
|
|
|
|
|
|
|
|
|
|
|
|
|
|
|
|||
RADIONUCLIDES |
DATE |
|
|
MCLG |
|
|
MCL |
|
|
HIGHEST |
RANGE DETECTED |
VIOLATION |
|
MAJOR SOURCES IN |
|
|||||||
|
|
|
|
|
|
|
|
AT INDIVIDUAL |
|
|
||||||||||||
9/8/2015 |
|
|
|
|
|
DETECTED LEVEL |
|
|
|
DRINKING WATER |
|
|||||||||||
|
|
|
|
|
|
|
|
|
|
SAMPLING SITES |
|
|
|
|
||||||||
|
|
|
|
|
|
|
|
|
|
|
|
|
|
|
|
|
|
|
|
|||
|
|
|
|
|
|
|
|
|
|
|
|
|
|
|
|
|
|
|
||||
Gross Alpha (pCi/L) |
9/18/2015 |
|
0 |
|
15 |
|
|
0.262 |
|
|
|
N/A |
|
No |
|
|
|
|
||||
|
|
|
|
|
|
|
|
|
|
|
|
|
|
|
|
|
|
|
Erosion of natural deposits |
|
||
9/18/2015 |
|
0 |
|
5 |
|
|
0.25 |
|
|
|
N/A |
|
No |
|
||||||||
|
|
|
|
|
|
|
|
|
|
|
|
|||||||||||
Combined (pCi/L) |
|
|
|
|
|
|
|
|
|
|
|
|
||||||||||
|
|
|
|
|
|
|
|
|
|
|
|
|
|
|
|
|
|
|
|
|
||
|
|
|
|
|
|
|
|
|
|
|
|
|
|
|
|
|
|
|
|
|
|
|
TURBIDITY * |
DATE |
|
|
MCLG |
|
|
TT |
HIGHEST SINGLE |
|
|
|
LOWEST |
VIOLATION |
|
MAJOR SOURCES IN |
|
||||||
|
|
|
|
|
|
|
MONTHLY |
|
|
|||||||||||||
|
|
|
|
MEASURMENT |
|
|
|
|
DRINKING WATER |
|
||||||||||||
|
|
|
|
|
|
|
|
|
|
|
|
PERCENTAGE |
|
|
|
|
||||||
|
|
|
|
|
|
|
|
|
|
|
|
|
|
|
|
|
|
|
|
|
||
|
|
|
|
|
|
|
|
|
|
|
|
|
|
|
|
|
|
|
|
|
||
Rapid Sand Filtration ** |
Daily |
|
|
N/A |
|
1 |
|
|
0.160 |
|
|
|
N/A |
|
No |
|
|
|
|
|||
(NTU) |
Compliance |
|
|
|
|
|
|
|
|
|
|
|
|
|||||||||
|
|
|
|
|
|
|
|
|
|
|
|
|
|
|
|
|
|
|||||
|
|
|
|
|
|
|
|
|
|
|
|
|
|
|
|
|
|
|
|
|
|
|
Rapid Sand Filtration ** |
|
|
|
|
|
|
|
TT: at least |
|
|
|
|
|
|
|
|
|
|
|
|
|
|
Monthly |
|
|
N/A |
|
|
95% of sam- |
|
|
N/A |
|
|
100% |
|
No |
|
|
|
|
||||
(NTU) |
|
|
|
ples per month |
|
|
|
|
|
|
|
|
|
|||||||||
|
|
|
|
|
|
|
|
|
|
|
|
|
|
|
|
|
|
|
||||
|
|
|
|
|
|
|
|
|
below 0.3 |
|
|
|
|
|
|
|
|
|
Soil Runoff |
|
||
Slow Sand Filtration *** |
Daily |
|
|
N/A |
|
5 |
|
|
0.30 |
|
|
|
NA |
|
No |
|
||||||
|
|
|
|
|
|
|
|
|
|
|
|
|
||||||||||
(NTU) |
Compliance |
|
|
|
|
|
|
|
|
|
|
|
|
|||||||||
|
|
|
|
|
|
|
|
|
|
|
|
|
|
|
|
|
|
|||||
|
|
|
|
|
|
|
|
|
|
|
|
|
|
|
|
|
|
|
|
|
|
|
Slow Sand Filtration *** |
|
|
|
|
|
|
|
TT: at least |
|
|
|
|
|
|
|
|
|
|
|
|
|
|
Monthly |
|
|
N/A |
|
|
95% of sam- |
|
|
NA |
|
|
100% |
|
No |
|
|
|
|
||||
(NTU) |
|
|
|
ples per month |
|
|
|
|
|
|
|
|
|
|||||||||
|
|
|
|
|
|
|
|
|
|
|
|
|
|
|
|
|
|
|
||||
|
|
|
|
|
|
|
|
|
below 0.3 |
|
|
|
|
|
|
|
|
|
|
|
|
|
|
|
|
|
|
|
|
|
|
|
|||||||||||||
‡ Heterotrophic Plate Count is not associated with health effects |
but is a method that measures the bacterial quality of water as an indicator of the adequacy of disinfection. |
|||||||||||||||||||||
|
|
|
|
|
|
|
|
|
|
|
|
|
|
|
|
|
|
|
|
|
|
|
UNREGULATED**** |
|
DATE |
|
ORSG/SMCL |
|
|
MCL |
|
|
HIGHEST SINGLE |
|
RANGE DETECTED |
VIOLATION |
|
MAJOR SOURCES IN |
|
||||||
|
|
|
|
|
|
MEASUREMENT |
|
|
|
DRINKING WATER |
|
|||||||||||
|
|
|
|
|
|
|
|
|
|
|
|
|
|
|
|
|
|
|
|
|||
|
|
|
|
|
|
|
|
|
|
|
|
|
|
|
|
|
|
|
|
|
|
|
|
|
|
|
|
|
|
|
|
|
|
|
|
|
|
|
|
|
|
|
|
Natural sources; |
|
Sodium (ppm) |
|
Yearly |
|
|
ORSG = 20 |
|
|
None |
|
|
13.7 |
|
|
|
N/A |
|
No |
|
|
runoff from use of |
|
|
|
|
|
|
|
|
|
|
|
|
|
|
|
|
|||||||||
|
|
|
|
|
|
|
|
|
|
|
|
|
|
|
|
|
|
|
|
|
|
|
|
|
|
|
|
|
|
|
|
|
|
|
|
|
|
|
|
|
|
|
|
on roadways |
|
|
|
|
|
|
|
|
|
|
|
|
|
|
|
|
|
|
|
|
|
|
|
|
Manganese (ppb) |
|
Yearly |
|
|
SMCL =50 |
|
|
None |
|
|
6 |
|
|
|
N/A |
|
No |
|
|
Erosion of natural |
|
|
|
|
|
|
|
|
|
|
|
|
|
|
|
deposits |
|
||||||||
|
|
|
|
|
|
|
|
|
|
|
|
|
|
|
|
|
|
|
|
|
|
|
|
|
|
|
|
|
|
|
|
|
|
|
|
|
|
|
|
|
|
|
|
|
|
Chloroform (ppb) |
|
Yearly |
|
|
ORSG = 70 |
|
|
None |
|
|
9.26 |
|
|
|
N/A |
|
No |
|
|
|
||
|
|
|
|
|
|
|
|
|
|
|
|
|
|
|
|
|
|
|
|
|
|
|
Bromodichloromethane |
|
|
|
|
|
None |
|
|
|
|
|
|
|
|
|
|
|
|
|
|
drinking water |
|
|
Yearly |
|
|
|
|
|
None |
|
|
0.77 |
|
|
|
N/A |
|
No |
|
|
chlorination |
|
||
(ppb) |
|
|
|
Established |
|
|
|
|
|
|
|
|
|
|
|
|||||||
|
|
|
|
|
|
|
|
|
|
|
|
|
|
|
|
|
|
|
|
|||
|
|
|
|
|
|
|
|
|
|
|
|
|
|
|
|
|
|
|
|
|
|
|
2020 SWSC WATER QUALITY INFORMATION TABLE (CONTINUED)
PUBLIC WATER SUPPLY IDENTIFICATION #1281000
DISINFECTION |
DATE |
MCLG |
MCL |
HIGHEST LRAA |
RANGE DETECTED |
|
MAJOR SOURCES IN |
|
AT INDIVIDUAL |
VIOLATION |
|||||||
DRINKING WATER |
||||||||
|
|
|
|
SAMPLING SITES |
|
|||
|
|
|
|
|
|
|
||
|
|
|
|
|
|
|
|
|
TTHMs (ppb) |
Quarterly |
N/A |
80 |
65.2 |
37.3 - 69.0 |
No |
||
(Total Trihalomethanes) |
chlorination |
|||||||
|
|
|
|
|
|
|||
|
|
|
|
|
|
|
|
|
Haloacetic Acids (HAA5) |
Quarterly |
N/A |
60 |
68.1 |
39.5 - 80.3 |
Yes |
||
(ppb) (Total Haloacetic Acids) |
chlorination |
|||||||
|
|
|
|
|
|
|||
|
|
|
|
|
|
|
|
|
HAA5 (ppb) by site |
DATE |
MCLG |
MCL |
HIGHEST |
Range Detected |
Violation |
Major Sources in Drinking |
|
LRAA |
Water |
|||||||
|
|
|
|
|
|
|||
833 Page Blvd. |
3/3/20, 6/3/20 |
N/A |
60 |
62.2 |
42.2 - 62.9 |
Yes |
|
|
|
|
|
|
|
|
|
|
|
Catalina Pump Station |
3/3/20, 6/3/20 |
N/A |
60 |
*65.7 |
45.0 - 57.0 |
Yes |
|
|
|
|
|
|
|
|
|
|
|
1400 State St. - Vibra |
3/3/20, 6/3/20 |
N/A |
60 |
67.3 |
45.5 - 73.2 |
Yes |
||
|
|
|
|
|
|
|
||
|
|
|
|
|
|
|
||
Center St. Fire Station, Ludlow |
3/3/20, 6/3/20, |
N/A |
60 |
68.1 |
44.1 - 80.3 |
Yes |
chlorination |
|
9/1/20 |
|
|||||||
|
|
|
|
|
|
|
||
|
|
|
|
|
|
|
|
|
1043 Sumner Ave. |
3/3/20, 6/3/20, |
N/A |
60 |
*66.7 |
41.9 - 65.3 |
Yes |
|
|
9/1/20 |
|
|||||||
|
|
|
|
|
|
|
||
|
|
|
|
|
|
|
|
|
322 Main St. |
6/3/20 |
N/A |
60 |
63.1 |
42.4 - 74.1 |
Yes |
|
|
|
|
|
|
|
|
|
|
*LRAA includes samples from 4th quarter 2019. Samples collected 12/3/2019: Catalina Pump Station, 77.9 ppb; 1043 Sumner Ave., 78.6 ppb.
Pilot Testing New
Treatment Methods at
West Parish Filters
West Parish Filters Water Treatment Plant was originally constructed in 1909, and last underwent significant upgrades in 1974.
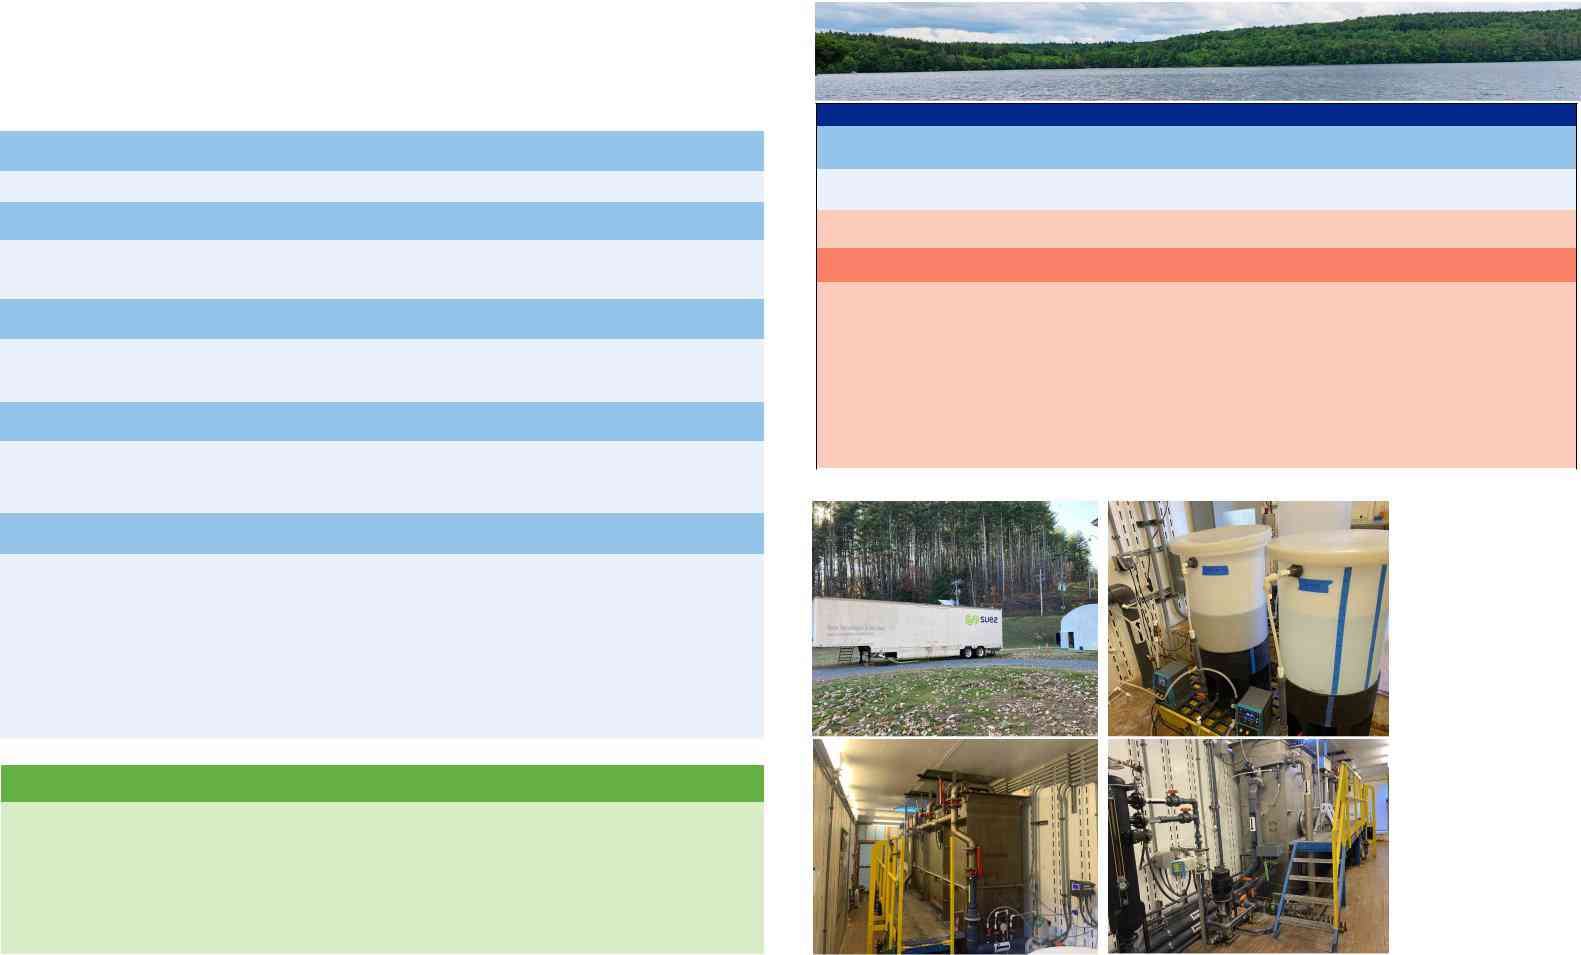
A modernization of the plant is currently underway (more information on page 6). Water treatment plants are careful- ly calibrated to the specific chemistry of the water source, and, to inform plant upgrades, a pilot study was conducted in 2019 and 2020 to determine which method is most effec- tive in treating raw water from Cobble Mountain Reservoir.
Pictured: In the fall of 2020 pilot testing was enhanced with the use of a portable trailer. In- side, dissolved air flotation (DAF) was further tested as a potential treatment method to remove more NOM from raw water from Cobble Mountain Reservoir.
3 |
4 |
Glossary of Terms
Public Notification - Haloacetic Acid (HAA5)
CFU (Colony Forming Unit)
- Heterotrophic Plate Counts (HPC) - Heterotrophic Plate Count is not asso- ciated with health effects but is a method that measures the bacterial quality of water as an indicator of the adequacy of disenfection.
LRAA (Locational Running Annual Average) - The average of four consecutive quarters of data taken at one location.
MCL (Maximum Contaminant Level) - The highest level of a contaminant that is allowed in drinking water. MCLs are set as close to the MCLGs as feasible using the best available treatment technology.
MCLG (Maximum Contaminant Level Goal) - The level of a contaminant in drinking water below which there is no known or expected risk to health. MCLGs allow for a margin of safety.
MRDL (Maximum Residual Disinfectant Level) - The highest level of a disinfectant allowed in drinking water. There is convincing evidence that addition of a disinfectant is necessary for control of microbial contaminants.
MRDLG (Maximum Residual Disinfectant Level Goal) - The level of a drinking water disinfectant below which there is no known expected risk to health. MRDLGs do not reflect the benefits of the use of disinfectants to control microbial contaminants.
N/A - Not Applicable
NTU (Nephelometric Turbidity Units) - A numeric value indicating the cloudiness of water.
ORSG (Massachusetts Office of Research and Standards Guideline) -
The concentration of a chemical in drinking water, at or below which adverse health effects are unlikely to occur after chronic (lifetime) exposure. If exceeded, it serves as an indicator of the potential need for further action.
ppb (parts per billion) ppm (parts per million)
pCi/L (picocuries per liter) - A measure of radioactivity.
SMCL (Secondary Maximum Contaminant Level) - The highest level of a contaminant that is allowed in drinking water for the secondary contaminants. These standards are developed to protect the aesthetic qualities of drinking water and are not health based.
TT (Treatment Technique) - A required process intended to reduce the |
West Parish Filters Water Treatment Plant in Westfield
Cross Connection Control Program
A cross connection is formed at any point where a drinking water line connects to a polluted source, such as boilers, air conditioning systems, fire sprinkler systems, irrigation systems, laboratory equipment, plating tanks, or chemical vats. In residences, a common cross connection is a garden hose attached to a fertilizer or chemical sprayer container, or a hose inserted into a pool. If water pressure drops, perhaps due to nearby fire hydrant use or a water main break, the resulting vacuum can pull pollutants back into the water system.
To prevent contamination through cross connections:
- Never submerge a hose in soapy water buckets, pet watering containers, pools, tubs, sinks, drains, or chemicals.
- Never attach a hose to a chemical sprayer without a backflow preventer.
- Buy and install an inexpensive hose connection vacuum breaker on every threaded water fixture.
- Buy appliances and equipment with a backflow preventer.
If you are an owner of industrial, institutional, or commercial property, you must have your facility’s internal plumbing surveyed for cross connection hazards, install proper backflow devices, or eliminate cross connections entirely. For more information, contact the Commission’s Cross Connection Control Program at
Backflow Prevention
Maximum Contaminant Level (MCL) Exceedance
In 2020 the Commission had three quarterly exceedances of the MCL for haloacetic acids (HAA5), which were reported to MassDEP. The MCL, or regulatory limit, for HAA5 is 60 parts per billion (ppb) for the locational running annual average (LRAA) at a sample station. The LRAA is determined by averaging the prior four quarterly samples at one location. In accordance with regulations, the Commission issued a Public Notification in bills, the news media, and the internet for each exceedance.
This was not an emergency, and there was no immediate or
Customers with further questions about this notice may call
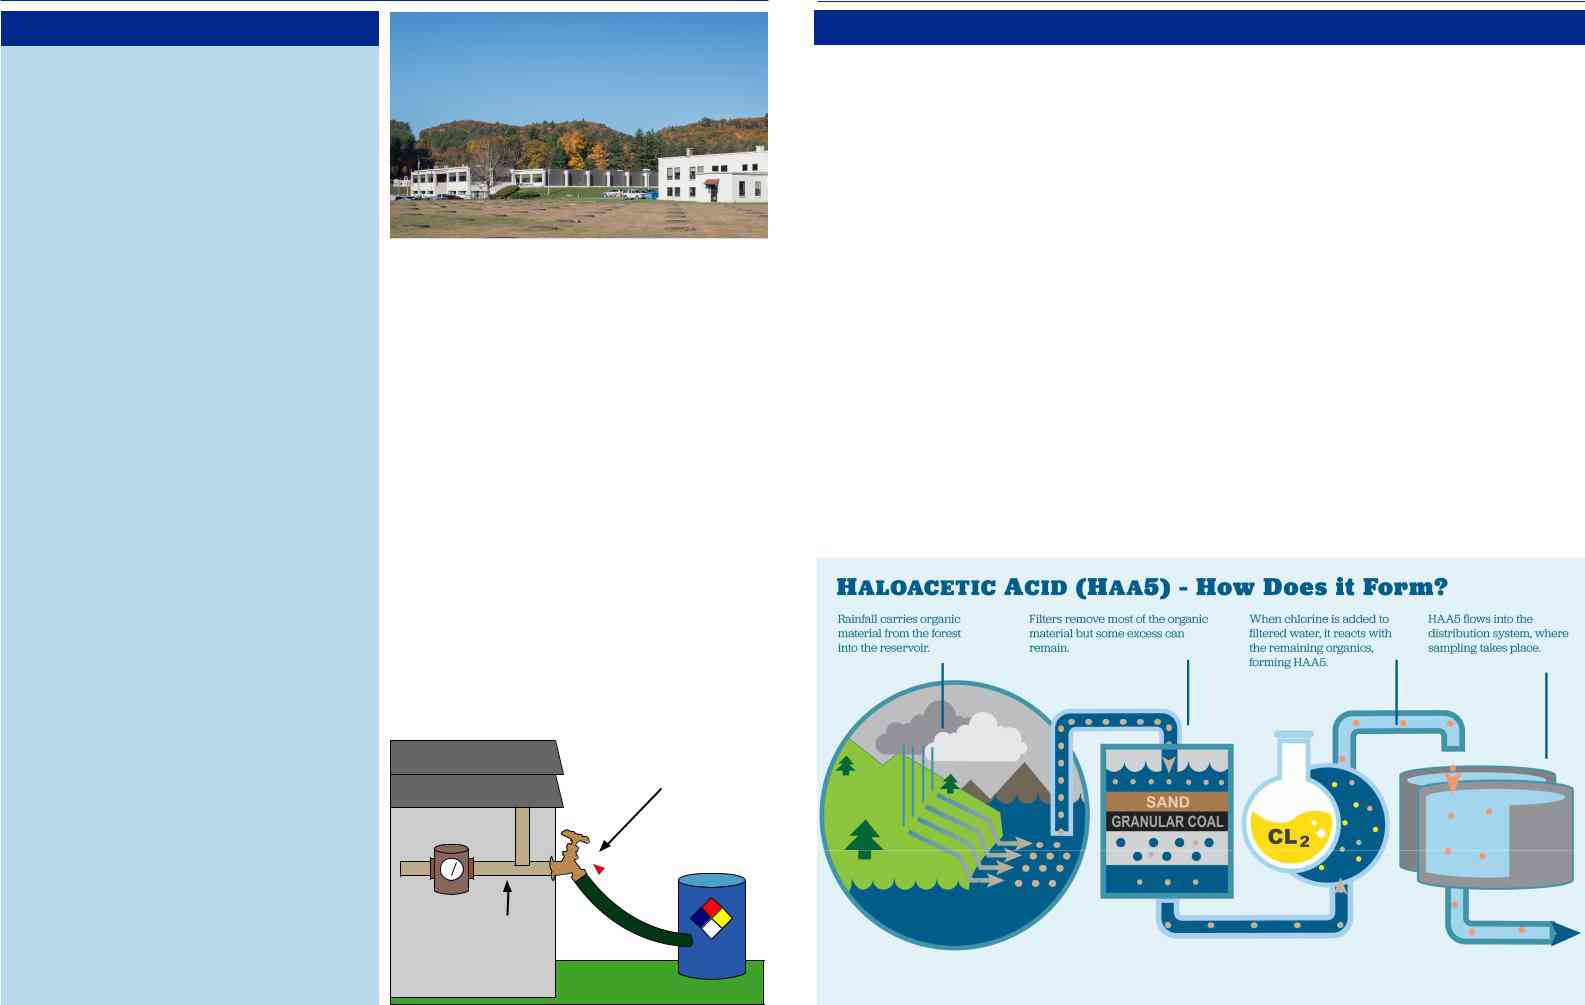
How does HAA5 Form?
HAA5 forms when chlorine, required for disinfection, interacts with nat- urally dissolved organic matter (NOM). NOM enters Cobble Mountain Reservoir, the main source of the Commission’s drinking water supply, through rain and snow runoff from the surrounding forest. The amount and types of dissolved NOM in Cobble Mountain Reservoir require an increased amount of chlorine to maintain safe disinfection.
What is the Commission Doing to Reduce HAA5?
Quarterly sampling conducted in 2020 indicated that dissolved NOM levels generally decreased from previously elevated levels. The im- provement in water quality results is due to changes in the reservoir raw water quality as well as measures implemented by the Commission to reduce HAA5 levels. These measures include reducing water storage time; optimizing treatment processes and chlorine dosages; and flushing the distribution system.
In addition to
A pilot study launched in 2019 and concluded in fall 2020 to determine the most effective treatment process to remove more dissolved NOM and reduce HAA5. Results from the pilot study are being used to inform the design of the permanent treatment plant upgrades necessary to reduce disinfection
A panel of national experts convened by the Commission is guiding these activities. The design of the permanent treatment plant upgrades is scheduled to begin in FY22. After the design is approved by MassDEP, construction is expected to begin in FY24.
level of a contaminant in drinking water. |
- Turbidity - A measure of the cloudiness of water. We monitor turbidity because it is a good indicator of the effectiveness of our filtration system.
- Rapid Sand Filtration - The turbidity level of the filtered water shall be less than or equal to 0.3 NTU in 95% of the measurements taken each month and shall not exceed a maximum of 1.0 NTU in any single measurement.
- Slow Sand Filtration - The turbidity level of the filtered water shall be less than or equal to 1.0 NTU in 95% of the measurements taken each month and shall not exceed a maximum of 5.0 NTU in any single measurement.
- Unregulated Contaminants - Substances for which EPA has set guide- lines but not established drinking water standards.
5
Normal Flow
Water Meter
A backflow preventer installed here will prevent toxic substances from flowing back into the public water system.
A backflow preventer installed here will prevent toxic substances from flowing back into your home plumbing system.
Back
Siphonage
TOXIC
6
IMPORTANT WATER INFORMATION INFORMACIÓN IMPORTANTE SOBRE EL AGUA
Este informe contiene información importante acerca de su aqua potable. Haga que alguien lo traduzca para usted, o hable con alguien que lo entienda.
Ce rapport contient des renseignements très importants sur votre eau potable. Veuillez le traduire ou parler à quelqu’un qui le comprend.
Este relatório contém informações muito importantes sobre a sua água potável. Por favor, traduzir ou falar com alguém que entende.
Questo rapporto contiene informazioni molto importanti sulla vostra acqua potabile. Si prega di tradurlo o parlare con qualcuno che lo capisce.
Raport ten zawiera bardzo ważne informacje na temat swojej wody pitnej. Proszę przetłumaczyć lub porozmawiać z kimś, kto go rozumie.
Báo cáo này có chứa thông tin rất quan trọng về nước uống của bạn. Xin vui lòng dịch nó hoặc nói chuyện với một ai đó hiểu nó.
Follow us on Facebook and
Twitter! @SpfldWaterSewer
Using Water Wisely
While the 22.5 billion gallon capacity of Cobble Mountain Reservoir is a plentiful supply for our region’s water needs, efficient water use is always a good idea. In the summer months, water usage can increase up to 30% due to lawn watering or
other outdoor uses. For tips and information on using water wisely outdoors, visit
https://waterandsewer.org/residential/
Did you know?
The Commission’s Residential Leak Detec- tion Program helps customers identify potential leaks and faulty fixtures in their homes. Want to get a handle on where you can save water in your house? Con- tact the Commission’s Operations Center at
Lead and Drinking Water
Lead is not present in the source water in Cobble Mountain Reservoir or treated water entering the distribution system. The most common sources of lead poisoning are paint and dust containing lead. In cases where lead is detected in drinking water, it is usually due to leaching from pipes that contain lead, such as lead service lines, or plumbing, fixtures, or solder in the home/building. Leaching is most likely to occur when the water is not moving, generally overnight or at other times when water is not used for several hours.
In 1992 the Commission began to proactively remove lead service lines from the distribution system. As of November 2005, all known lead service lines have been removed and replaced. At the treatment plant, water is treated with orthophosphate to inhibit the corrosion of home/ building plumbing and to help prevent lead from leaching into water. Testing for the presence of lead and copper is regulated under EPA’s Lead and Copper Rule. Testing takes place in
Health Risks of Lead in Drinking Water
If present, elevated levels of lead can cause serious health problems, especially for pregnant women and young children. Lead in drinking water is primarily from materials and components associated with service lines and home plumbing. The Commission is responsible for providing high quality drinking water, but cannot control the variety of materials used in plumbing components. When your water has been sitting for several hours, you can minimize the potential for lead expo- sure by flushing your tap for 30 seconds to 2 minutes before using water for drinking or cooking. If you are concerned about lead in your water, you may wish to have your water tested. Information on lead in drinking water, testing methods, and steps you can take to minimize exposure is available from the Safe Drinking Water Hotline
LEAD AND COPPER SAMPLING TABLE - 2018
|
|
Action |
90th PERCENTILE |
SAMPLING SITES |
|
MAJOR SOURCES IN |
|
SUBSTANCE |
MCLG |
EXCEEDING THE |
VIOLATION |
||||
Level (AL) |
SAMPLE |
DRINKING WATER |
|||||
|
|
ACTION LEVELS |
|
||||
|
|
|
|
|
|
||
|
|
|
|
|
|
|
|
Copper (ppm) |
1.3 |
AL = 1.3 |
0.0814 |
0 out of 50 |
No |
Corrosion of household |
|
|
|
|
|
|
|
plumbing systems |
|
Lead (ppb) |
0 |
AL = 15.0 |
4.7 |
2 out of 50 |
No |
||
|
|||||||
|
|
|
|
|
|
|
The above table represents the last round of lead and copper sampling that took place in the summer of 2018. The next required round of lead and copper sam- pling will take place in the summer of 2021 per regulatory requirements.
AL (Action Level) - The concentration of a contaminant that if exceeded, triggers treatment or other requirements that a water system must follow.
90th Percentile - Out of every 10 homes sampled, 9 were at or below this level.
MCL (Maximum Contaminant Level) - The highest level of a contaminant that is allowed in drinking water. MCLs are set as close to the MCLGs as feasible using the best available treatment technology.
MCLG (Maximum Contaminant Level Goal) - The level of a contaminant in drinking water below which there is no known or expected risk to health. MCLGs allow for a margin of safety.
Contaminants
Springfield Water and Sewer Commission
EWG's drinking water quality report shows results of tests conducted by the water utility and provided to the Environmental Working Group by the Massachusetts Department of Environmental Protection, as well as information from the U.S. EPA Enforcement and Compliance History database (ECHO). For the latest quarter assessed by the U.S. EPA (January 2019 - March 2019), tap water provided by this water utility was in compliance with federal health-based drinking water standards.
Utility details
- Serves: 236763
- Data available: 2012-2017
- Data Source: Surface water
- Total: 15
Contaminants That Exceed Guidelines
- Bromodichloromethane
- Chloroform
- Dichloroacetic acid
- Radium%2C combined (-226 & -228)
- Total trihalomethanes (TTHMs)
- Trichloroacetic acid
Other Detected Contaminants
- Barium
- Chromium (hexavalent)
- Dibromoacetic acid
- Haloacetic acids (HAA5)
- Manganese
- Monochloroacetic acid
- Nitrate
- Strontium
- Vanadium
Reminder
Always take extra precautions, the water may be safe to drink when it leaves the sewage treatment plant but it may pick up pollutants during its way to your tap. We advise that you ask locals or hotel staff about the water quality. Also, note that different cities have different water mineral contents.
Sources and Resources
Sources Cited
Additional Resources
Springfield Tap Water
It seems as if the Massachusetts town of Springfield is under a constant onslaught of questions regarding its water. Why is it that this beautiful city, once known as a manufacturing center, now ranks among the worst cities in all of America when it comes to tap water quality? The answer lies within the municipal sewer system and why Springfield is allowed to rely on that system in the first place. In Springfield, there are many sources of both garbage and residential wastewater that flow through the city. These systems allow the contaminants flowing through the city to become trapped in pipes that haven’t been cleaned or aren’t working correctly.
Because these contaminants have nowhere else to go, they end up building up in pipes and eventually flooding out through the town’s main water pipe. While there are over fifty different types of heavy metals present in Springfield’s tap water, none of them pose a threat to human life unless residents are repeatedly exposed to them. Heavy metals such as lead, zinc, copper, and mercury have shown links with various health problems ranging from autism to cancer. Only a few city residents are even aware of their presence without having to deal with the consequences. If this isn’t enough to make you want to find a new home in Springfield, nothing will.
Fortunately, there is a straightforward way for the citizens of Springfield to have access to safe tap water. The town has partnered with several different companies in recent years to provide clean, filtered water directly from their tap water faucets. By placing a simple order for purified water, you’ll be helping to protect not only your family but also the future of the entire community. These companies work hard to ensure that all of the water that passes through their pipes is entirely toxin-free.
Springfield Drinking Water
If you live in Springfield, Massachusetts, you know that there are some problems with your tap water. The city of Springfield was among the worst hit during the recent water contamination outbreak. This is the case because the city relies on wells to supply the majority of its drinking water. While it is excellent that the wells provide clean water, if you want to have some hope of protecting yourself from contaminated water, you need to have a good filter installed in your home. In this article, I will give you a good idea of protecting your family and the city of Springfield.
In many towns throughout the United States, residents find that they can receive clean drinking water from their homes. Still, they have to install costly filtration systems to do so. This is often at considerable expense. It is not always guaranteed that the system you end up buying will perform as promised. However, in Springfield, the problem is compounded because the majority of the drinking water that goes into the city comes from wells. This means that for every well, there is a filter system that needs to be installed.
Many towns do not tell you that it is illegal to reverse osmosis or any filtering system in the home. Although these systems are used in some restaurants, they are simply unnecessary to provide you with safe drinking water. A perfect solution is installing a multi-stage water filter system that will remove any contaminants from the water you drink. That will also remove any harmful bacteria that may be present. By doing this, you will ensure that you and your family remain healthy. Of course, to keep yourself healthy, you need to make sure that you get enough nutritious food and make sure that you try to take a multivitamin with you daily.
Springfield Water and Sewer
Springfield, MA, is a beautiful city located in the state of Massachusetts. The city was named after General George Washington, who is the first American to settle here. In 1776, this small town was laid off from the Massachusetts Company of Water and Sewer for nonpayment of water and sewerage bills. It was sold to a company in West Springfield, which made its headquarters in the heart of the city, on Elm Street. This is where the first City Hall stands today.
As is the case with many towns in Massachusetts, Springfield, MA, has had many water quality problems over the years. Since the town was created, there have been more complaints about poor-quality water or sewage than anywhere else in Massachusetts. Fortunately, these issues seem to be dwindling in recent years as the Town has merged with the neighboring towns of Medfield and West Springfield to form the more wonderful Springfield, MA city. Many residents still live in the old houses that they grew up in. Still, because the quality of the water and sewers has improved so much, most people can enjoy clean and fresh water from their faucets these days.
One of the most popular attractions in town is the famed “Springfield Museum.” This historical society was designed to help students learn about various historical topics. It has achieved success doing just that. One of the most famous exhibits is entitled The Great Depression. It brings to light the terrible depression that the country experienced. Still, it also gives a glimpse into how people dealt with it at that time. Most visitors to this museum find it fascinating and very emotional.
Springfield Water Treatment
Are you looking for a reliable and cost-effective solution to clean your water in Springfield, Massachusetts? Well, you need to take time out of your hectic schedule and hire a reputable company that offers state-of-the-art water treatment systems for your home. Many local companies provide this service, but only a few can deliver on their promise of quality services. Before you choose one of these Massachusetts companies, here are some things that you should know to ensure that you will be satisfied with the results of your investment.
Water in Springfield, MA, is treated with chlorine and fluoride to purify it. Both of these substances are considered necessary by the Environmental Protection Agency because they can eliminate germs and harmful contaminants from your water supply. The problem arises when the treatment facility does not have the proper tools and equipment to implement effective filtration procedures. This is where the role of a professional company becomes crucial. These services companies are equipped with the latest and most advanced filtration system, ensuring that your water is free from bacteria and other harmful microorganisms.
Springfield Water Quality
If you are considering moving to Springfield, MA, and are concerned about the quality of your water supply, there are a few things that you can do. If you live on a large piece of property, installing a water filter is one option you may want to explore. There are many types of filters available that are made specifically for use in a residential area, and most are very affordable. You can also look into purchasing a bottle, tank, or pitcher for your water so that you have access to drinking water throughout the entire house. You must realize how important a high-quality water source is, as you never know when contamination or other water issues will occur.
Suppose you don’t want to install a filter system to purify your water. In that case, you can purchase a pre-filtered water pitcher or filter that can be hooked up to your kitchen sink. This way, you will always have access to clean, healthy water. Even if you aren’t in your home much, it is still essential that you can drink safe, great-tasting water throughout the day. You may not think that this is an issue now. Still, you never know when contamination or other water issues will occur, which is why having quality water in the first place is so important.
Springfield Water Supply
A big problem that has recently come up with many residents of Springfield, MA, is the lack of a reliable and adequate water delivery system. It seems that a series is delivering the town’s water supply of individual borehole tanks throughout the city, each of which requires a separate permit to drill for and pump water. When it comes to pumping out the water, these individual borehole tanks are a problem. They pose a severe safety risk and pose an even more significant threat when they become full of algae, which can cause some significant health problems in the town.
There are other towns in the Massachusetts area that have had to deal with this situation as well. One of those towns is Dedham, where the entire town was evacuated due to a mold bloom. The officials said that the water wasn’t safe to drink and that it was likely to start hurting people as soon as it made its way through the system. Even though this is a small town, it’s still a problem when you have large swaths of woods that lie entirely under the town’s waterline. For people whose homes sit in these woods, it’s a nightmare not to be able to go into your home and shower without running the water and having to get rid of the water yourself. This can be especially bad during the colder months when all you need to do is take a quick shower, and no one is around to shower or bathe you.
Last month, the town of Springfield went on a particular alert, asking residents if they wanted to help by donating any old bottled water that they have lying around. The officials said that this was a great way to clean the water and put it to better use. They plan to contact different groups and families to fetch old bottles of water regularly. This is just another step toward ensuring that the water supply in the town of Springfield remains safe. Suppose you have excess bottled water sitting around at home. In that case, there are several different groups out there who would be more than happy to pick it up off of your hands and give it to those in need.