Table of Contents
Can You Drink Tap Water in Queen Creek?
Yes, Queen Creek's tap water is generally considered safe to drink as Queen Creek has no active health based violations of the Safe Drinking Water Act (SDWA) that we are aware of. Other factors such as lead piping in a home, or low levels of pollutants on immunocompromised individuals, should also be considered, however. To find more recent info we might have, you can check out our boil water notice page or the city's water provider website.
According the EPA’s ECHO database, from April 30, 2019 to June 30, 2022, Queen Creek's water utility, Town of Queen Creek, had 5 non-health-based violations of the Safe Drinking Water Act. For more details on the violations, please see our violation history section below. The last violation for Queen Creek was resolved on Dec. 31, 2019. This assessment is based on the Town of Queen Creek water system, other water systems in the city may have different results.
While tap water that meets the EPA health guidelines generally won’t make you sick to your stomach, it can still contain regulated and unregulated contaminants present in trace amounts that could potentially cause health issues over the long-run. These trace contaminants may also impact immunocompromised and vulnerable individuals.
The EPA is reviewing if it’s current regulations around pollutant levels in tap water are strict enough, and the health dangers posed by unregulated pollutants, like PFAS.
Water Quality Report for Queen Creek Tap Water
The most recent publicly available numbers for measured contaminant levels in Queen Creek tap water are in its 2020 Water Quality Report. As you can see, there are levels which the EPA considers to be acceptable, but being below the maximum allowable level doesn’t necessarily mean the water is healthy.
Lead in tap water, for example, is currently allowed at up to 15ppb by the EPA, but it has set the ideal goal for lead at zero. This highlights how meeting EPA standards doesn’t necessarily mean local tap water is healthy.
EPA regulations continue to change as it evaluates the long term impacts of chemicals and updates drinking water acceptable levels. The rules around arsenic, as well as, lead and copper are currently being re-evaluated.
There are also a number of "emerging" contaminants that are not currently. For example, PFAS (Per- and polyfluoroalkyl substances), for which the EPA has issued a health advisory. PFAS are called "forever chemicals" since they tend not to break down in the environment or the human body and can accumulate over time.
We recommend looking at the contaminants present in Queen Creek's water quality reports, or getting your home's tap water tested to see if you should be filtering your water.
Queen Creek Tap Water Safe Drinking Water Act Violation History - Prior 10 Years
Below is a ten year history of violations for the water system named Town of Queen Creek for Queen Creek in Arizona. For more details please see the "What do these Violations Mean?" section below.
From Oct. 1, 2019 to Dec. 31, 2019, Queen Creek had 5 non-health based Safe Drinking Water Act violations with the violation category being Monitoring and Reporting, more specifically, the violation code was Monitoring, Regular which falls into the Chemicals rule code group, and the Radionuclides rule code family for the following contaminant codes: Gross Alpha, Excl. Radon and U, Combined Uranium, Combined Radium (-226 and -228), Radium-228, Radium-226.
From June 1, 2017 to Aug. 31, 2017, Queen Creek had 2 non-health based Safe Drinking Water Act violations with the violation category being Monitoring and Reporting, more specifically, the violation code was Monitoring and Reporting (DBP) which falls into the Disinfectants and Disinfection Byproducts Rule rule code group, and the Stage 2 Disinfectants and Disinfection Byproducts Rule rule code family for the following contaminant codes: TTHM, Total Haloacetic Acids (HAA5).
Is there Lead in Queen Creek Water?
Based on the EPA’s ECHO Database, 90% of the samples taken from the Queen Creek water system, Town of Queen Creek, between sample start date and sample end date, were at or below, 0.00225 mg/L of lead in Queen Creek water. This is 15.0% of the 0.015 mg/L action level. This means 10% of the samples taken from Queen Creek contained more lead.
While Queen Creek water testing may have found 0.00225 mg/L of lead in its water, that does not mean your water source has the same amount. The amount of lead in water in a city can vary greatly from neighborhood to neighborhood, or even building to building. Many buildings, particularly older ones, have lead pipes or service lines which can be a source of contamination. To find out if your home has lead, we recommend getting you water tested.
No amount of lead in water is healthy, only less dangerous. As lead accumulates in our bodies over time, even exposure to relatively small amounts can have negative health effects. For more information, please check out our Lead FAQ page.
Are there PFAS in Queen Creek Tap Water?
Currently, testing tap water for PFAS isn’t mandated on a national level. We do have a list of military bases where there have been suspected or confirmed leaks. There appears to be at least one military base - Williams AFB - near Queen Creek with suspected leaks.
With many potential sources of PFAS in tap water across the US, the best information we currently have about which cities have PFAS in their water is this ewg map, which you can check to see if Queen Creek has been evaluated for yet.
Our stance is better safe than sorry, and that it makes sense to try to purify the tap water just in case.
Queen Creek SDWA Violation History Table - Prior 10 Years
| Compliance Period | Status | Health-Based? | Category Code | Code | Rule Code | Contaminant Code | Rule Group Code | Rule Family Code |
|---|---|---|---|---|---|---|---|---|
| 10/01/2019 - 12/31/2019 | Resolved | No | Monitoring and Reporting (MR) | Monitoring, Regular (03) | Radionuclides (340) | Gross Alpha, Excl. Radon and U (4000) | Chemicals (300) | Radionuclides (340) |
| 10/01/2019 - 12/31/2019 | Resolved | No | Monitoring and Reporting (MR) | Monitoring, Regular (03) | Radionuclides (340) | Combined Uranium (4006) | Chemicals (300) | Radionuclides (340) |
| 10/01/2019 - 12/31/2019 | Resolved | No | Monitoring and Reporting (MR) | Monitoring, Regular (03) | Radionuclides (340) | Combined Radium (-226 and -228) (4010) | Chemicals (300) | Radionuclides (340) |
| 10/01/2019 - 12/31/2019 | Resolved | No | Monitoring and Reporting (MR) | Monitoring, Regular (03) | Radionuclides (340) | Radium-228 (4030) | Chemicals (300) | Radionuclides (340) |
| 10/01/2019 - 12/31/2019 | Resolved | No | Monitoring and Reporting (MR) | Monitoring, Regular (03) | Radionuclides (340) | Radium-226 (4020) | Chemicals (300) | Radionuclides (340) |
| 06/01/2017 - 08/31/2017 | Resolved | No | Monitoring and Reporting (MR) | Monitoring and Reporting (DBP) (27) | Stage 2 Disinfectants and Disinfection Byproducts Rule (220) | TTHM (2950) | Disinfectants and Disinfection Byproducts Rule (200) | Stage 2 Disinfectants and Disinfection Byproducts Rule (220) |
| 06/01/2017 - 08/31/2017 | Resolved | No | Monitoring and Reporting (MR) | Monitoring and Reporting (DBP) (27) | Stage 2 Disinfectants and Disinfection Byproducts Rule (220) | Total Haloacetic Acids (HAA5) (2456) | Disinfectants and Disinfection Byproducts Rule (200) | Stage 2 Disinfectants and Disinfection Byproducts Rule (220) |
What do these Violations Mean?
Safe Drinking Water Act Violations categories split into two groups, health based, and non-health based. Generally, health based violations are more serious, though non-health based violations can also be cause for concern.
Health Based Violations
- Maximum contaminant levels (MCLs) - maximum allowed contaminant level was exceeded.
- Maximum residual disinfectant levels (MRDLs) - maximum allowed disinfectant level was exceeded.
- Other violations (Other) - the exact required process to reduce the amounts of contaminants in drinking water was not followed.
Non-Health Based Violations
- Monitoring and reporting violations (MR, MON) - failure to conduct the required regular monitoring of drinking water quality, and/or to submit monitoring results on time.
- Public notice violations (Other) - failure to immediately alert consumers if there is a serious problem with their drinking water that may pose a risk to public health.
- Other violations (Other) - miscellaneous violations, such as failure to issue annual consumer confidence reports or maintain required records.
SDWA Table Key
| Field | Description |
|---|---|
| Compliance Period | Dates of the compliance period. |
| Status |
Current status of the violation.
|
| Health-Based? | Whether the violation is health based. |
| Category Code |
The category of violation that is reported.
|
| Code | A full description of violation codes can be accessed in the SDWA_REF_CODE_VALUES (CSV) table. |
| Contaminant Code | A code value that represents a contaminant for which a public water system has incurred a violation of a primary drinking water regulation. |
| Rule Code |
Code for a National Drinking Water rule.
|
| Rule Group Code |
Code that uniquely identifies a rule group.
|
| Rule Family Code |
Code for rule family.
|
For more clarification please visit the EPA's data dictionary.
Queen Creek Water - Frequently Asked Questions
| By Phone: | 480-430-1073 |
| By Email: | brian.quill@queencreek.org |
| By Mail: | ATTN: Brian Quill 19715 S 220TH ST BUILDING B QUEEN CREEK, AZ, 85142 |
Existing customers can login to their Town of Queen Creek account to pay their Queen Creek water bill by clicking here.
If you want to pay your Town of Queen Creek bill online and haven't made an account yet, you can create an account online. Please click here to create your account to pay your Queen Creek water bill.
If you don't want to make an account, or can't remember your account, you can make a one-time payment towards your Queen Creek water bill without creating an account using a one time payment portal with your account number and credit or debit card. Click here to make a one time payment.
Moving to a new house or apartment in Queen Creek means you will often need to put the water in your name with Town of Queen Creek. In order to put the water in your name, please click the link to the start service form below. Start service requests for water bills typically take two business days.
Leaving your house or apartment in Queen Creek means you will likely need to take your name off of the water bill with Town of Queen Creek. In order to take your name off the water bill, please click the link to the stop service form below. Stop service for water bills requests typically take two business days.
USER SUBMITTED RATINGS
- Drinking Water Pollution and Inaccessibility
- Water Pollution
- Drinking Water Quality and Accessibility
- Water Quality
The above data is comprised of subjective, user submitted opinions about the water quality and pollution in Queen Creek, measured on a scale from 0% (lowest) to 100% (highest).
Related FAQS
Queen Creek Water Quality Report (Consumer Confidence Report)
The EPA mandates that towns and cities consistently monitor and test their tap water. They must report their findings in an annual Consumer Confidence Report. Below is the most recent water quality report from Queen Creek's Water. If you would like to see the original version of the report, please click here.
ANNUAL
Water Quality Report
WATER TESTING PERFORMED IN 2020
Where Our Water Comes From
The Town of Queen Creek’s drinking water comes from groundwater sources. Groundwater is pumped from a combination of the 22 active drinking water wells located throughout the water distribution system. Water is either pumped directly into the distribution system or pumped to fill a water storage tank for future use. A small amount of chlorine disinfection is applied at entry points to the distribution system in order to maintain federal drinking water standards.
PRODUCED BY THE TOWN OF QUEEN CREEK
Our Commitment to Service
The Town of Queen Creek Water Division is proud to present the 2020 Annual Water Quality Report demonstrating our exceptional water quality. Through the challenges brought by the
The Water Division ended 2020 with over 30,000 active connections, attributed to the remarkable new
The Water Division continues to focus on system integrity and reliability through infrastructure lifespan. Nearly 15 miles of new waterlines have been designed and approximately 20 miles installed, allowing the water system to operate more efficiently. Construction began on the Barney Farms three million gallon reservoir, to be completed and in service by the end of 2021. Construction was completed on the Church Farms East three million gallon reservoir.
Two wells were rehabilitated and added to our water sources. Two wells were purchased and developed with intent to be online by end of 2021. The water service area was extended to the south with the purchase and merger of the Diversified Water System, adding two active wells and three expected to be completed by end of 2021. We continue to aggressively pursue our meter testing and replacement program, which helps the Water Division ensure that water meters measure accurately, minimizing water loss.
Our geographic information systems and technology staff continue to develop efficiency improvements through technological changes, allowing staffing to access information remotely and enabling faster responses, work order completions and emergency mitigation. Improvements are continually evaluated to allow customers more access to billing and scheduling.
The
We excitingly embrace the growth the Town of Queen Creek is experiencing. The Water Division remains dedicated to providing reliable high quality water. We greatly appreciate the partnership we have cultivated with the community and are honored to serve you in the future.
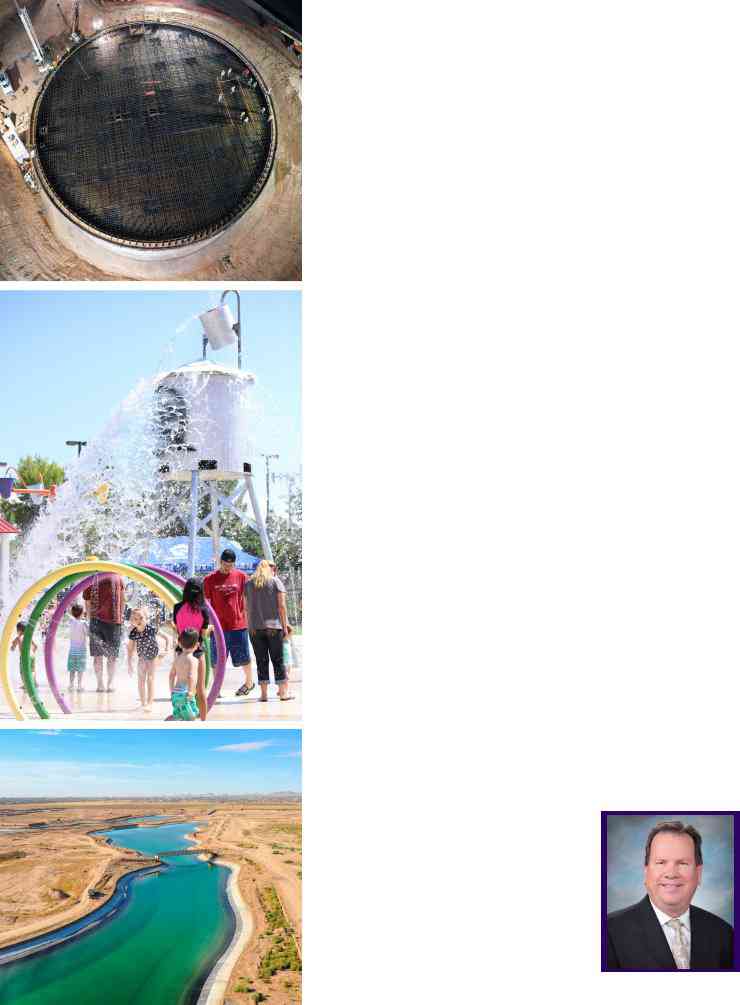
Paul Gardner, Utilities Director
2 |
2020 WATER QUALITY REPORT – TOWN OF QUEEN CREEK |
|
|
Substances That Could be in Water
The sources of drinking water (both tap water and bottled water) include rivers, lakes, streams, ponds, reservoirs, springs, and wells. As water travels over the surface of the land or through the ground, it dissolves
Microbial contaminants, such as viruses and bacteria, which may come from sewage treatment plants, septic systems, agricultural livestock operations, and wildlife.
Inorganic contaminants, such as salts and metals, which can be
Pesticides and herbicides, which may come from a variety of sources such as agriculture, urban storm water runoff, and residential uses.
Organic chemical contaminants, including synthetic and volatile organic chemicals, which are byproducts of industrial processes and petroleum production, and can also come from gas stations, urban storm water runoff, and septic systems.
Radioactive contaminants, which can be naturally occurring or be the result of oil and gas production and mining activities.
Drinking water, including bottled water, may reasonably be expected to contain at least small amounts of some contaminants. The presence of contaminants does not necessarily indicate that water poses a health risk.
More information about contaminants and potential health effects can be obtained online at EPA.gov/Safewater or by calling the EPA’s Safe Drinking Water Hotline at (800)
Count on Us
Delivering
Our licensed water professionals are knowledgeable on a wide range of subjects, including mathematics, biology, chemistry, and physics.
Some of the tasks they complete on a regular basis include:
- Operating and maintaining equipment to produce and store water.
- Monitoring and inspecting machinery, meters, gauges, and operating conditions.
- Conducting tests and inspections on water and evaluating the results.
- Maintaining optimal water chemistry.
- Applying data to formulas that determine treatment requirements, flow levels, and concentration levels.
- Documenting and reporting test results and system operations to regulatory agencies.
- Serving our community through customer support, education, and outreach.
So, the next time you turn on your faucet, think of the skilled professionals who stand behind every drop.
2020 WATER QUALITY REPORT – TOWN OF QUEEN CREEK |
3 |
|
|
Water Quality
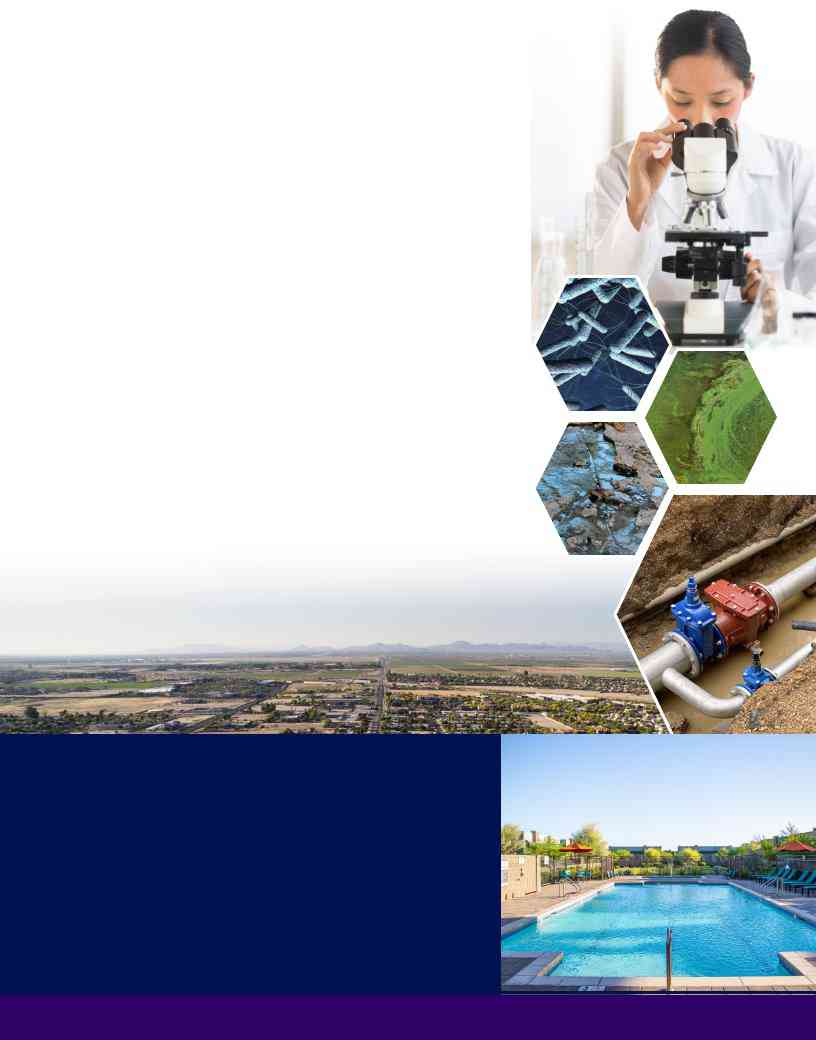
To ensure that tap water is safe to drink, the EPA prescribes regulations which limit the amount of certain contaminants in water provided by public water systems. FDA regulations establish limits for contaminants in bottled water which must provide the same protection for public health. Some people may be more vulnerable to contaminants in drinking water than the general population.
The Water Division continues to take hundreds of water samples to determine the presence of microbiological and various contaminants in the system. Additionally, the Water Division participates in the Arizona Department of Environmental Quality Monitoring Assistance Program (MAP) to perform regular sampling and testing of all system wells for radioactive, inorganic, volatile organic, and synthetic organic contaminants. Efforts to sample and test our water has documented that the Town of Queen Creek water has exceeded all health standards. The table below shows only those contaminants that were detected in the water, many more were tested with no measurable amounts detected. Although all the substances listed here are under the Maximum Contaminant Level (MCL), we feel it is important
that you know exactly what was detected and how much of the substance was present in the water.
2020 RESULTS
CONTAMINANT
SAMPLE YEAR VIOLATION
RANGE
AVERAGE MCL MCLG
TYPICAL SOURCE
Alpha emitters (pCi/L) |
2020 |
No |
ND – 4.0 |
0.5 |
15 |
0 |
Erosion of natural deposits |
|
|
|
|
|
|
|
|
|
|
Arsenic (ppb) |
2020 |
No |
1.0 – 2.8 |
2.0 |
10 |
0 |
Erosion of natural deposits; Runoff from |
|
orchards; Runoff from glass and electronics |
||||||||
|
|
|
|
|
|
|
production wastes |
|
|
|
|
|
|
|
|
|
|
Barium (ppm) |
2020 |
No |
0.036 – 0.048 |
0.041 |
2 |
2 |
Discharge of drilling wastes; Discharge from |
|
metal refineries; Erosion of natural deposits |
||||||||
|
|
|
|
|
|
|
||
Chlorine (ppm) |
2020 |
No |
0.33 – 1.49 |
0.8 |
4 |
4 |
Water additive used to control microbes |
|
|
|
|
|
|
|
|
|
|
Chromium (ppb) |
2020 |
No |
ND – 2.6 |
1.8 |
100 |
100 |
Discharge from steel and pulp mills; Erosion of |
|
natural deposits |
||||||||
|
|
|
|
|
|
|
||
|
|
|
|
|
|
|
|
|
Fluoride (ppm) |
2020 |
No |
0.17 – 0.29 |
0.23 |
4 |
4 |
Erosion of natural deposits; Water additive |
|
which promotes strong teeth; Discharge from |
||||||||
|
|
|
|
|
|
|
fertilizer and aluminum factories |
|
|
|
|
|
|
|
|
|
|
Haloacetic Acids (ppb) |
2020 |
No |
<2.0 |
ND |
60 |
NA |
||
|
|
|
|
|
|
|
|
|
Nitrate (ppm) |
2020 |
No |
0.56 – 8.9 |
4.3 |
10 |
10 |
Runoff from fertilizer use; Leaching from septic |
|
tanks, sewage; Erosion of natural deposits |
||||||||
|
|
|
|
|
|
|
||
|
|
|
|
|
|
|
|
|
Sodium (ppm) |
2020 |
No |
39 – 78 |
66 |
NA |
NA |
Naturally occurring |
|
|
|
|
|
|
|
|
|
|
Total Coliform |
2020 |
No |
0 – 1.25 |
0.10 |
5 |
0 |
Naturally present in the environment |
|
(% positive samples/month) |
||||||||
|
|
|
|
|
|
|
||
Total Trihalomethanes (ppb) |
2020 |
No |
ND – 5.1 |
4.6 |
80 |
NA |
||
|
|
|
|
|
|
|
|
|
Uranium (ppb) |
2020 |
No |
1.9 |
1.9 |
30 |
0 |
Erosion of natural deposits |
|
|
|
|
|
|
|
|
|
|
Xylenes (ppm) |
2020 |
No |
ND – 0.002 |
0.00 |
10 |
10 |
Discharge from petroleum factories; Discharge |
|
from chemical factories. |
||||||||
|
|
|
|
|
|
|
Tap water samples collected for lead and copper analyses from specific community sample sites
CONTAMINANT
YEAR VIOLATION NUMBER o v e r AL 90TH PERCENTILE AL MCLG
TYPICAL SOURCE
Copper |
(ppm) |
2019 |
No |
0 |
0.13 |
1.3 |
1.3 |
Corrosion of household plumbing |
|
systems; Erosion of natural deposits |
|||||||||
|
|
|
|
|
|
|
|
||
|
|
|
|
|
|
|
|
|
|
Lead |
(ppb) |
2019 |
No |
0 |
1.5 |
15 |
0 |
Corrosion of household plumbing |
|
systems; Erosion of natural deposits |
|||||||||
|
|
|
|
|
|
|
|
4 |
2020 WATER QUALITY REPORT – TOWN OF QUEEN CREEK |
|
|
Definitions
AL: Action Level – The concentration of a contaminant that, if exceeded, triggers treatment or other requirements that a community water system shall follow
LRAA: Locational Running Annual Average – The average of sample analytical results for samples taken at a particular monitoring location during the previous four calendar quarters. Amount Detected values for TTHMs and HAAs are reported as the highest LRAAs
MCL: Maximum Contaminant Level – The highest level of a contaminant that is allowed in drinking water. MCLs are set as close to the MCLGs as feasible using the best available treatment technology
MCLG: Maximum Contaminant Level Goal – The level of a contaminant in drinking water below which there is no known or expected risk to health. MCLGs allow for a margin of safety
MRDL: Maximum Residual Disinfectant Level – The
MRDLG: Maximum Residual Disinfectant Level Goal
- The level of a drinking water disinfectant below which there is no known or expected risk to health. MRDLGs do not reflect the benefits of the use of disinfectants to control microbial contaminants
NA: Not applicable
ND: Not detected – Concentration too low to be detected by laboratory equipment
pCi/L: picocuries per liter – A measure of radioactivity
ppb: parts per billion – One part substance per billion parts (or micrograms per liter)
ppm: parts per million – One part substance per million parts (or milligrams per liter)
2020 WATER QUALITY REPORT – TOWN OF QUEEN CREEK |
5 |
|
|
Source Water Assessment
In 2002, the Arizona Department of Environmental Quality (ADEQ) completed a source water assessment for six groundwater wells used by the Queen Creek Water Company, now known as the Town of Queen Creek Water Division. The assessment reviewed adjacent land uses that could pose risks to water sources. These risks include, but are not limited to, gas stations, landfills, dry cleaners, agricultural fields, wastewater treatment plants, and mining activities. Once ADEQ identified
the adjacent land uses, the source waters were ranked according to their potential to become contaminated. The result of the assessment for the six wells was low risk from adjacent land use and low risk to source water. For more information or to request a copy of the source water assessment, please contact Nicole Petker at (480)
IMPORTANT Health Information
While your drinking water meets EPA standards for arsenic, it does contain low levels of arsenic. EPA’s standard balances the current understanding of possible health effects against the costs of removing arsenic from drinking water. EPA continues to research the health effects of low levels of arsenic, which is a mineral known to cause cancer in humans at high concentrations and is linked to other health effects such as skin damage and circulatory problems.
Nitrate in drinking water at levels above 10 ppm is a health risk for infants of less than six (6) months of age. High nitrate levels in drinking water can cause “blue baby syndrome.” Nitrate levels may rise quickly for short periods of time because of rainfall or agricultural activity. If you are caring for an infant, you should ask advice from your health care provider. Visit epa.gov for additional information.
Lead in Home Plumbing
If present, elevated levels of lead can cause serious health problems, especially for pregnant women and young children. Lead, in drinking water, is primarily from materials and components associated with service lines and home plumbing. The Town of Queen Creek is responsible for providing
in plumbing components. When your water has been sitting for several hours, you can minimize the potential for lead exposure by flushing your tap for 30 seconds before using water for drinking or cooking. Information on lead in drinking water, testing methods, and steps you can take to minimize exposure is available from the Safe Drinking Water Hotline at
-
426-4791 or EPA.gov/Safewater.
6 |
2020 WATER QUALITY REPORT – TOWN OF QUEEN CREEK |
|
|
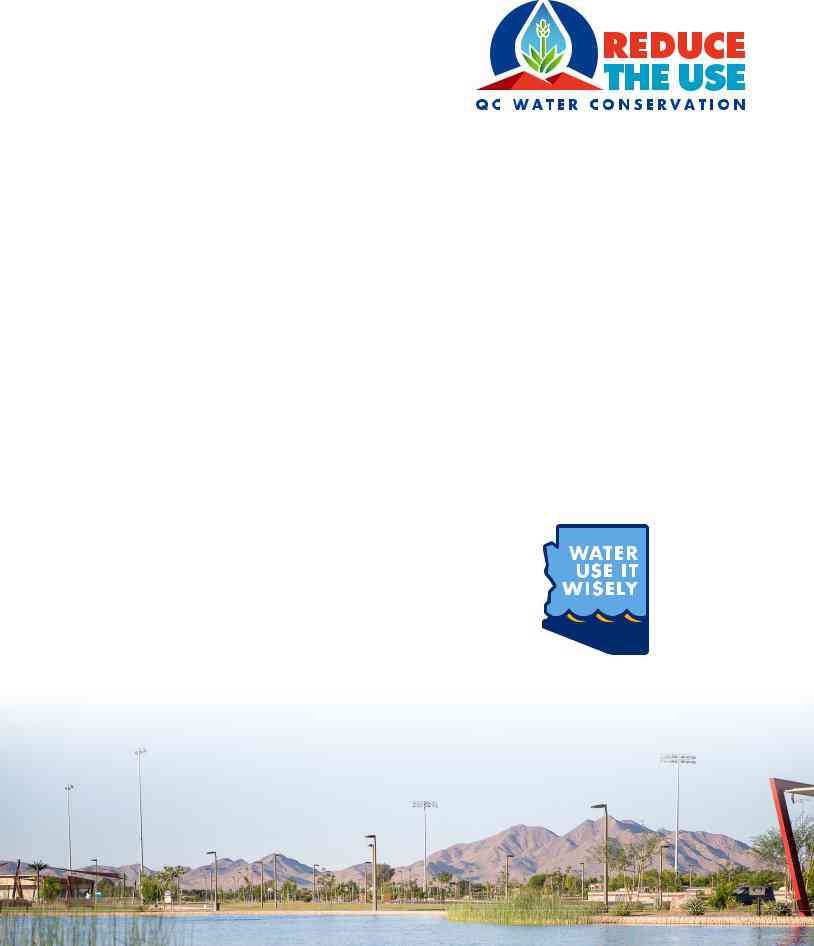
Water Conservation
Water is a precious natural resource. Please join the Town of Queen Creek and reduce your water use. QueenCreekAZ.gov/ReducetheUse
FIVE TIPS TO REDUCE YOUR USE
-
Water your landscape efficiently
Up to 70% of water use is outdoors. Find out how much water your landscape needs. QueenCreekAZ.gov/WaterGuides -
Are you using a lot of water and don’t know where it’s going?
Learn how to read your water meter and take charge! QueenCreekAZ.gov/WaterAudit -
Attend a FREE landscape workshop
Learn about drip system design and install, how to water your landscape properly, maintain and repair your irrigation system, utilize proper pruning techniques, use low water use plants for an inviting backyard and much more. QueenCreekAZ.gov/WaterSmart -
Hire a Smartscape trained landscape professional
A Smartscape landscaper is trained in planning, planting and caring for landscapes in our desert environment.
Smartscape.org/Directory -
Take the guess work out of watering
For FREE monthly watering reminders, text WHENTOWATER to 33222.
Town of Queen Creek Water Conservation is a proud partner of Water Use It Wisely, an organization devoted to promoting water conservation for a sustainable future. Sign up for their free monthly
WATER CONSERVATION EDUCATION IN THE SCHOOLS
The Town of Queen Creek is committed to creating a sustainable future for residents. We proudly partner with the Environmental Education Exchange and Abracadabra Productions to offer innovative, educational outreach to Queen Creek and San Tan Valley area schools.
Abracadabra Water Conservation Magic Shows are
Queen Creek’s Our Water, Our Future is a water education program designed for
2020 WATER QUALITY REPORT – TOWN OF QUEEN CREEK |
7 |
|
|
Benefits of Chlorination
Disinfection, a chemical process used to control
HOW CHLORINATION HELPS:
Potent Germicide Reduction in the level of many
Taste and Odor Reduction of many disagreeable tastes and odors like
Biological Growth Elimination of slime bacteria, molds, and algae that commonly grow in water supply reservoirs, on the walls of water mains, and in storage tanks.
Chemical Removal of hydrogen sulfide (which has a rotten egg odor), ammonia, and other nitrogenous compounds that have unpleasant tastes and hinder disinfection. It also helps to remove iron and manganese from raw water.
QUESTIONS?
For more information about this report, or to ask drinking water related questions, please contact Nicole Petker, Water Resource Analyst, at (480)
Residents may provide public comment to the Queen Creek Town Council regarding water quality at the regularly scheduled Town Council Meetings, usually held on the first and third Wednesdays of each month. The Town Council meeting calendar can be viewed online at QueenCreekAZ.gov/Calendar.
DISEASE
PATHOGENS
ALGAE
HYDROGEN
SULFIDE
TOWN OF QUEEN CREEK | 22358 S. ELLSWORTH ROAD, QUEEN CREEK, ARIZONA 85142
Contaminants
Town of Queen Creek
EWG's drinking water quality report shows results of tests conducted by the water utility and provided to the Environmental Working Group by the Arizona Department of Environmental Quality, as well as information from the U.S. EPA Enforcement and Compliance History database (ECHO). For the latest quarter assessed by the U.S. EPA (January 2019 - March 2019), tap water provided by this water utility was in compliance with federal health-based drinking water standards.
Utility details
- Serves: 74842
- Data available: 2012-2017
- Data Source: Groundwater
- Total: 14
Contaminants That Exceed Guidelines
- Arsenic
- Chromium (hexavalent)
- Nitrate
- Nitrate and nitrite
- Radium%2C combined (-226 & -228)
- Total trihalomethanes (TTHMs)
- Uranium
Other Detected Contaminants
- Barium
- Chromium (total)
- Fluoride
- Haloacetic acids (HAA5)
- Molybdenum
- Strontium
- Vanadium
Reminder
Always take extra precautions, the water may be safe to drink when it leaves the sewage treatment plant but it may pick up pollutants during its way to your tap. We advise that you ask locals or hotel staff about the water quality. Also, note that different cities have different water mineral contents.