Table of Contents
Can You Drink Tap Water in Pasco?
Yes, Pasco's tap water is generally considered safe to drink as Pasco has no active health based violations of the Safe Drinking Water Act (SDWA) that we are aware of. Other factors such as lead piping in a home, or low levels of pollutants on immunocompromised individuals, should also be considered, however. To find more recent info we might have, you can check out our boil water notice page or the city's water provider website.
According the EPA’s ECHO database, from April 30, 2019 to June 30, 2022, Pasco's water utility, Pasco Water Department, had 0 violations of the Safe Drinking Water Act. For more details on the violations, please see our violation history section below. The last violation for Pasco was resolved on Dec. 31, 2017. This assessment is based on the Pasco Water Department water system, other water systems in the city may have different results.
While tap water that meets the EPA health guidelines generally won’t make you sick to your stomach, it can still contain regulated and unregulated contaminants present in trace amounts that could potentially cause health issues over the long-run. These trace contaminants may also impact immunocompromised and vulnerable individuals.
The EPA is reviewing if it’s current regulations around pollutant levels in tap water are strict enough, and the health dangers posed by unregulated pollutants, like PFAS.
Water Quality Report for Pasco Tap Water
The most recent publicly available numbers for measured contaminant levels in Pasco tap water are in its 2020 Water Quality Report. As you can see, there are levels which the EPA considers to be acceptable, but being below the maximum allowable level doesn’t necessarily mean the water is healthy.
Lead in tap water, for example, is currently allowed at up to 15ppb by the EPA, but it has set the ideal goal for lead at zero. This highlights how meeting EPA standards doesn’t necessarily mean local tap water is healthy.
EPA regulations continue to change as it evaluates the long term impacts of chemicals and updates drinking water acceptable levels. The rules around arsenic, as well as, lead and copper are currently being re-evaluated.
There are also a number of "emerging" contaminants that are not currently. For example, PFAS (Per- and polyfluoroalkyl substances), for which the EPA has issued a health advisory. PFAS are called "forever chemicals" since they tend not to break down in the environment or the human body and can accumulate over time.
We recommend looking at the contaminants present in Pasco's water quality reports, or getting your home's tap water tested to see if you should be filtering your water.
Pasco Tap Water Safe Drinking Water Act Violation History - Prior 10 Years
Below is a ten year history of violations for the water system named Pasco Water Department for Pasco in Washington. For more details please see the "What do these Violations Mean?" section below.
From Dec. 1, 2017 to Dec. 31, 2017, Pasco had 1 non-health based Safe Drinking Water Act violation with the violation category being Monitoring and Reporting, more specifically, the violation code was Monitoring of Treatment (SWTR-Filter) which falls into the Microbials rule code group, and the Surface Water Treatment Rules rule code family for the following contaminant code: Surface Water Treatment Rule.
For the compliance period beginning July 1, 2016, Pasco had 1 non-health based Safe Drinking Water Act violation with the violation category being Other Violation, more specifically, the violation code was Consumer Confidence Report Complete Failure to Report which falls into the Other rule code group, and the Consumer Confidence Rule rule code family for the following contaminant code: Consumer Confidence Rule.
Is there Lead in Pasco Water?
Based on the EPA’s ECHO Database, 90% of the samples taken from the Pasco water system, Pasco Water Department, between sample start date and sample end date, were at or below, 0.0015 mg/L of lead in Pasco water. This is 10.0% of the 0.015 mg/L action level. This means 10% of the samples taken from Pasco contained more lead.
While Pasco water testing may have found 0.0015 mg/L of lead in its water, that does not mean your water source has the same amount. The amount of lead in water in a city can vary greatly from neighborhood to neighborhood, or even building to building. Many buildings, particularly older ones, have lead pipes or service lines which can be a source of contamination. To find out if your home has lead, we recommend getting you water tested.
No amount of lead in water is healthy, only less dangerous. As lead accumulates in our bodies over time, even exposure to relatively small amounts can have negative health effects. For more information, please check out our Lead FAQ page.
Are there PFAS in Pasco Tap Water?
Currently, testing tap water for PFAS isn’t mandated on a national level. We do have a list of military bases where there have been suspected or confirmed leaks. There appears to be at least one military base - Umatilla Chemical Depot - near Pasco with suspected leaks.
With many potential sources of PFAS in tap water across the US, the best information we currently have about which cities have PFAS in their water is this ewg map, which you can check to see if Pasco has been evaluated for yet.
Our stance is better safe than sorry, and that it makes sense to try to purify the tap water just in case.
Pasco SDWA Violation History Table - Prior 10 Years
| Compliance Period | Status | Health-Based? | Category Code | Code | Rule Code | Contaminant Code | Rule Group Code | Rule Family Code |
|---|---|---|---|---|---|---|---|---|
| 12/01/2017 - 12/31/2017 | Resolved | No | Monitoring and Reporting (MR) | Monitoring of Treatment (SWTR-Filter) (36) | Surface Water Treatment Rule (121) | Surface Water Treatment Rule (0200) | Microbials (100) | Surface Water Treatment Rules (120) |
| 07/01/2016 - | Resolved | No | Other Violation (Other) | Consumer Confidence Report Complete Failure to Report (71) | Consumer Confidence Rule (420) | Consumer Confidence Rule (7000) | Other (400) | Consumer Confidence Rule (420) |
What do these Violations Mean?
Safe Drinking Water Act Violations categories split into two groups, health based, and non-health based. Generally, health based violations are more serious, though non-health based violations can also be cause for concern.
Health Based Violations
- Maximum contaminant levels (MCLs) - maximum allowed contaminant level was exceeded.
- Maximum residual disinfectant levels (MRDLs) - maximum allowed disinfectant level was exceeded.
- Other violations (Other) - the exact required process to reduce the amounts of contaminants in drinking water was not followed.
Non-Health Based Violations
- Monitoring and reporting violations (MR, MON) - failure to conduct the required regular monitoring of drinking water quality, and/or to submit monitoring results on time.
- Public notice violations (Other) - failure to immediately alert consumers if there is a serious problem with their drinking water that may pose a risk to public health.
- Other violations (Other) - miscellaneous violations, such as failure to issue annual consumer confidence reports or maintain required records.
SDWA Table Key
| Field | Description |
|---|---|
| Compliance Period | Dates of the compliance period. |
| Status |
Current status of the violation.
|
| Health-Based? | Whether the violation is health based. |
| Category Code |
The category of violation that is reported.
|
| Code | A full description of violation codes can be accessed in the SDWA_REF_CODE_VALUES (CSV) table. |
| Contaminant Code | A code value that represents a contaminant for which a public water system has incurred a violation of a primary drinking water regulation. |
| Rule Code |
Code for a National Drinking Water rule.
|
| Rule Group Code |
Code that uniquely identifies a rule group.
|
| Rule Family Code |
Code for rule family.
|
For more clarification please visit the EPA's data dictionary.
Pasco Water - Frequently Asked Questions
| By Mail: | PO Box 293 Pasco, WA, 99301 |
Existing customers can login to their Pasco Water Department account to pay their Pasco water bill by clicking here.
If you want to pay your Pasco Water Department bill online and haven't made an account yet, you can create an account online. Please click here to create your account to pay your Pasco water bill.
If you don't want to make an account, or can't remember your account, you can make a one-time payment towards your Pasco water bill without creating an account using a one time payment portal with your account number and credit or debit card. Click here to make a one time payment.
Moving to a new house or apartment in Pasco means you will often need to put the water in your name with Pasco Water Department. In order to put the water in your name, please click the link to the start service form below. Start service requests for water bills typically take two business days.
Leaving your house or apartment in Pasco means you will likely need to take your name off of the water bill with Pasco Water Department. In order to take your name off the water bill, please click the link to the stop service form below. Stop service for water bills requests typically take two business days.
USER SUBMITTED RATINGS
- Drinking Water Pollution and Inaccessibility
- Water Pollution
- Drinking Water Quality and Accessibility
- Water Quality
The above data is comprised of subjective, user submitted opinions about the water quality and pollution in Pasco, measured on a scale from 0% (lowest) to 100% (highest).
Related FAQS
Pasco Water Quality Report (Consumer Confidence Report)
The EPA mandates that towns and cities consistently monitor and test their tap water. They must report their findings in an annual Consumer Confidence Report. Below is the most recent water quality report from Pasco's Water. If you would like to see the original version of the report, please click here.
Water Quality Report
2020
This report contains important information about your drinking water. |
Este informe contiene informaciÓn importante acerca de su agua |
You can access this report in English or Spanish on the City of Pasco’s |
potable. Usted puede acceder a este informe en ingles o español en el |
website, or pick up a copy of either at Customer Service in City Hall. |
sitio de web de la Ciudad, o recoger una copia de cualquiera de los dos |
|
en el Departamento de AtenciÓn al Cliente en el Alcalde Municipal. |
PWS ID# WA0664003
City of Pasco provides high quality water for you!
The City of Pasco is proud to present our annual water quality report. This edition covers all testing completed from January through December 2020. We are pleased to tell you that our compliance with all state and federal drinking water laws remains exemplary. As in the past, we are committed to delivering the best quality drinking water. To that end, we remain vigilant in meeting the challenges of source water protection, water conservation, and community education while continuing to serve the needs of all of our water users.
For more information, or for any questions relating to your drinking water, please call Derek Wiitala, Public Works Division Manager, at (509)
Community Participation
Your input on water quality is always welcome. The City Council meets every Monday (except for the 5th Monday of the month) at 7:00 p.m. in Council Chambers at City Hall (525 N. 3rd Avenue, Pasco). Please feel free to participate in these meetings, or watch them live on
Where does our water come from and how is it treated?
The Columbia River supplies all of the City of Pasco’s domestic water supply.
Our water is treated through 2 distinctive water treatment plants (WTP) of differing technologies. The Butterfield WTP is known as a “conventional” plant and has been in existence for many years. The Butterfield plant has gone through several upgrades over the years to improve efficiency and to keep up with
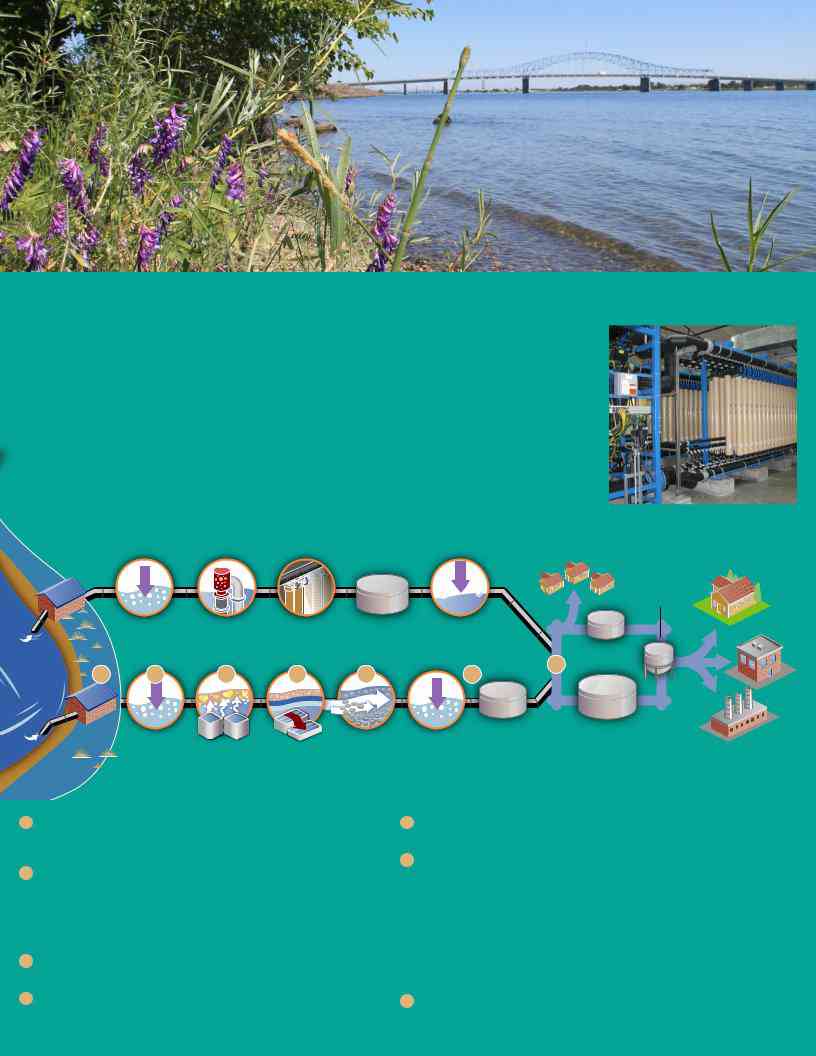
The West Pasco WTP is known as a “Pressure Membrane Direct Micro- Filtration” Plant. Unlike the Butterfield WTP, water is forced through a filter of fibers encased in a vertical column (a filter) capable of filtering out particles (and microbes) down to 0.1 microns in size. There are 116 of these filters per rack.
Currently the plant has 2 racks with the capability of treating 6 MGD of high quality drinking water. The West Pasco plant’s treatment process is depicted below. It is located at the far west end of Pasco in the vicinity of the
Together, the 2 plants treated a total of 5.09 billion gallons of water in 2020: that’s an average of 424 million gallons of water a month, or 14.0 million gallons of water a day.
WEST PASCO WATER TREATMENT PLANT
River Intake
Pumphouse
|
|
|
|
Fluoride |
Addition of |
Pressure |
Clearwell for |
Addition of |
|
Coagulants, and |
remove larger |
membrane |
disinfection |
Fluoride |
Chlorine (Pre). |
particles. |
contact time |
|
Elevated Tank (Rd. 68)
2.5 million gallon
reservoir
Broadmoor 1 million
COLUMBIA |
1 |
2 |
3 |
4 |
5 |
6 |
RIVER |
|
|
|
|
|
|
7
gallon reservoir
River Intake |
|
|
|
|
|
|
Riverview 10 million |
Addition of |
|
|
Mixed Media |
Addition of Chlorine |
Clearwell for |
gallon reservoir |
|
Pumphouse |
|
|
|||||
|
Coagulants, and |
Flocculation Basins |
Sedimentation |
Filter |
(Post), Fluoride, and |
disinfection |
|
|
Chlorine (Pre). |
|
Caustic Soda |
contact time |
|
||
|
|
Basins |
|
|
|||
|
|
|
|
|
|
|
BUTTERFIELD WATER TREATMENT PLANT
Water is pumped from the Columbia River to the WTP. As the water enters the plant, Potassium Permanganate is added to oxidize the organics in the raw water. This helps to control taste and odors, and to enhance the disinfection process.
Coagulants are added to attract small particles together to form larger particles (floc), which are more readily removed during sedimentation and filtration processes. Dosages of the coagulant are varied according to the purity of the untreated water.
Chlorine is also added at this point to kill
The coagulant continues to mix in the water and create floc as the water makes its way through the flocculation basins and into the sedimentation basins.
The larger floc particles, and other existing solids, settle out as the water slowly makes its way through the sedimentation basins on its way to the mixed media filters.
The water then flows through mixed media filters (silica, sand and coal), which filter out the remaining unsettled particulate matter.
Filtered water enters the clear well tank which provides contact time for the
The entire process is continually monitored and tested in order to ensure that the process and the water meets or exceeds state and federal regulations. After the clear well tank, the water is of excellent quality and is ready for distribution and use.
The water is then pumped to the City’s distribution and storage system. The water is distributed throughout Pasco for residential, business, and industrial use via more than 200 miles of pipeline.
SAMPLING
RESULTS
DURING THE PAST YEAR we have taken hundreds of water samples in order to determine the presence of contaminants. The table below shows those contaminants detected in the water. Although all of the substances listed here are under the Maximum Contaminant Level (MCL), we feel it is important that you know exactly what was detected and how much of the substance was present in the water.
REGULATED SUBSTANCES
Substances |
Year |
MCL |
MCLG |
CONCENTRATION IN SAMPLE |
Violation |
Typical Source |
||||
(Unit of |
Sampled |
|
|
Highest |
|
Sample |
|
Running |
|
|
|
|
|
|
|
|
|||||
Measure) |
|
|
|
|
|
|
|
|||
|
|
|
Result |
|
Range |
|
Average |
|
|
|
|
|
|
|
|
|
|
|
|||
Total Coliform |
|
Presence in |
|
No presence |
|
No presence |
|
|
|
|
2020 |
more than 5% |
0 |
detected in |
|
in any of |
|
NA |
No |
Naturally present in the |
|
Bacteria |
of monthly |
any routine |
|
1,005 routine |
|
environment |
||||
|
|
|
|
|
|
|||||
|
|
samples |
|
sample |
|
samples |
|
|
|
|
Chlorine (ppm) |
2020 |
MRDL = 4 |
MRDLG |
1.3 |
|
.1 - 1.30 |
|
.7 |
No |
Water additive used to |
= 4 |
|
|
control microbes |
|||||||
|
|
|
|
|
|
|
|
|
||
Fluoride (ppm) |
2020 |
4 |
4 |
.86 |
|
.51 |
|
.67 |
No |
Erosion of natural deposits; |
|
|
Hydrofluosilicic Acid, a water additive |
||||||||
|
|
|
|
|
|
|
|
|
|
which promotes dental health. |
Nitrate (ppm) |
2020 |
10 |
10 |
0.8 |
|
Butterfield WTP: 0.58 |
No |
Runoff from fertilizer use; Leaching |
||
|
West Pasco WTP: 0.8 |
from septic tanks, sewage; Erosion |
||||||||
|
|
|
|
|
|
|
of natural deposits. |
|||
TOCs (ppm) |
2020 |
TT |
NA |
1.28 |
|
.66 - 1.28 |
|
.89 |
No |
Naturally present in the |
|
|
environment |
||||||||
|
|
|
|
|
|
|
|
|
|
|
TURBIDITY 1 |
|
|
|
|
|
|
|
|
|
|
|
|
|
|
|
|
|
|
|
|
|
Butterfield |
2020 |
TT |
95% of |
.06 |
|
.02 |
|
.03 |
No |
|
WTP (NTU) |
|
|
100% < .3 NTU |
No |
|
|||||
|
|
samples |
|
|
|
|
Soil runoff |
|||
West Pasco |
|
|
|
|
|
|
.014 |
No |
||
2020 |
TT |
< 0.3 NTU |
.091 |
|
.010 |
|
|
|||
WTP (NTU) |
|
|
100% < .3 NTU |
No |
|
|||||
|
|
|
|
|
|
|
|
|||
DISINFECTION BY- PRODUCTS (Stage 2 Rule as of Dec. 2013) |
|
|
|
|
|
|
||||
|
|
|
|
|
|
|
|
|
|
|
HAAs (ppb) |
2020 |
60 |
NA |
48.0 |
|
1.3 - 48.0 |
|
25.4 2 |
No |
|
|
|
disinfection |
||||||||
|
|
|
|
|
|
|
|
|
|
|
|
|
|
|
|
|
|
|
|
|
|
TTHMs (ppb) |
2020 |
80 |
NA |
63.9 |
|
15.8 - 63.9 |
|
44.0 2 |
No |
|
|
|
disinfection |
||||||||
|
|
|
|
|
|
|
|
|
|
|
|
|
|
|
|
|
|
|
|
|
|
LEAD AND COPPER (TAP WATER SAMPLES WERE COLLECTED FROM 32 HOMES IN THE SERVICE AREA)
Substance |
Year |
Action |
MCLG |
Amount |
Homes Above |
|
|
|
Detected |
Violation |
Typical Source |
||||||
(Unit of Measure) |
Sampled |
Level |
[MRDLG] |
Action Level |
||||
(90th%tile) |
|
|
||||||
|
|
|
|
|
|
|
||
Copper (ppm) |
2020 |
1.3 |
1.3 |
0.167 |
0 |
No |
Corrosion of household plumbing systems; Erosion of |
|
natural deposits; Leaching from wood preservatives |
||||||||
|
|
|
|
|
|
|
||
Lead (ppb) 3 |
2020 |
15 |
0 |
1.5 |
0 |
No |
Corrosion of household plumbing systems; Erosion of |
|
natural deposits; Leaching from wood preservatives |
||||||||
|
|
|
|
|
|
|
||
|
|
|
|
|
|
|
|
1 Turbidity is a measure of the cloudiness of the water. We monitor it because it is a good indicator of the effectiveness of our filtration system. During the reporting year, turbidity is measured continuously from a sample stream of our finished water. All measurements exceeded water quality standards.
-
Stage 2 Rule requires sampling at multiple sites with conformance determined by
site-specific results or “Local Running Annual Average” (LRAA) - Lead was not detected in 24 out of 31 homes sampled.
TABLE DEFINITIONS
AL (Action Level): The concentration of a contaminant which, if exceeded, triggers treatment or other requirements which a water system must follow.
MRDL (Maximum Residual Disinfectant Level): The highest level of a disinfectant allowed in drinking water. There is convincing evidence that addition of a disinfectant is necessary for control of microbial contaminants.
MRDLG (Maximum Residual Disinfectant Level Goal): The level of a drinking water disinfectant below which there is no known or expected risk to health. MRDLGs do not reflect the benefits of the use of disinfectants to control microbial contamination.
MCLG (Maximum Contaminant Level Goal): The level of a contaminant in drinking water below which there is no known or expected risk to health. MCLGs allow for a margin of safety.
MCL (Maximum Contaminant Level): The highest level of a contaminant that is allowed in drinking water. MCLs are set as close to the MCLGs as feasible using the best available treatment technology.
NA: Not applicable
ND: Not detected
- (Treatment Technique): A required process intended to reduce the level of a contaminant in drinking water.
ppm (parts per million): One part substance per million parts water (or milligrams per liter).
ppb (parts per billion): One part substance per billion parts water (or micrograms per liter).
NTU (Nephelometric Turbidity Units): Measurement of the clarity, or turbidity, of water.
WTP Water Treatment Plant TOC Total organic carbon HAA Haloacetic Acids TTHM Total Trihalomethanes
LRAA Local Running Annual Average
MESSAGE FROM THE EPA
Some people may be more vulnerable to contaminants in drinking water than the general population. Immunocompromised persons such as persons with cancer undergoing chemotherapy, persons who have undergone organ transplants, people with HIV/AIDS or other immune system disorders, some elderly, and infants may be particularly at risk from infections. These people should seek advice about drinking water from their health care providers. The U.S. EPA/CDC (Centers for Disease Control and Prevention) guidelines on appropriate means to lessen the risk of infection by Cryptosporidium and other microbial contaminants are available from the Safe Drinking Water Hotline at (800)
All drinking water, including bottled water, may reasonably be expected to contain at least small amounts of some contaminants. The presence of contaminants does not necessarily indicate that the water poses a health risk. More information about contaminants and potential health effects can be obtained by calling the Environmental Protection Agency’s Safe Drinking Water Hotline at (800)
FACTS ABOUT LEAD IN YOUR DRINKING WATER
Lead is a toxic heavy metal that is found in the earth’s crust. Lead does not usually naturally occur in drinking water, but it can be present in household plumbing or water service lines and contaminate drinking water through corrosion of plumbing materials.
Measures taken during the last 30 years have greatly reduced exposures to lead in tap water. These measures include actions taken under the requirements of the 1986 and
1996 amendments to the Safe Drinking Water Act and the U.S. Environmental Protection Agency’s (EPA’s) Lead and Copper Rule.
Even so, lead still can be found in some metal water taps or water pipes connecting a house to the main water line in the street. But lead found in drinking water usually comes from the
corrosion of older fixtures or from the solder that connects pipes in household plumbing. When water sits in these pipes for several hours, lead can leach into the water supply. If present, elevated levels of lead can cause serious health problems, especially for pregnant women and young children. When your water has been sitting for several hours, you can minimize the potential for lead exposure by flushing your tap for 30 seconds to 2 minutes before using water for drinking or cooking. If you are concerned about lead in your drinking water, you may wish to have your water tested. Information on lead in drinking water, testing methods, and other steps you can take to minimize exposure is available from the Safe Drinking Water Hotline at (800)
The amount of lead corroded from metal plumbing generally increases as water acidity increases. Generally, acidic water with a pH below 7 is considered more corrosive than water with a pH higher than 7. The City of Pasco adjusts and maintains the pH in the treated water to what is considered a little higher than a neutral level, (a pH of 7.4 - 7.5). This helps to reduce corrosion throughout the water system.
Over the past 25 years, the City of Pasco has approached the lead issue with a proactive philosophy. A lead and copper monitoring program was implemented around 1990 in conformance with all EPA and Department of Health (DOH) regulatory requirements. The most recent results of lead and copper monitoring can be found in the table elsewhere in this report.
Over this time period, the City of Pasco has systematically replaced any suspected pipe or service lines containing lead materials. That effort continues today during any repairs, retrofits, or waterline replacements. All materials used in new water service or pipe installations are lead free.
The City of Pasco continues to work with the Washington State Dept. of Health to ensure optimal results during these programs, and to reach our ultimate goal of a completely lead- free water system.

“THE WATER YOU AND YOUR FAMILY DRINK MEETS AND EXCEEDS
ALL STATE AND FEDERAL WATER QUALITY STANDARDS.”
Taking care of our precious resources today helps ensure a livable city for the future.
The City of Pasco continues to experience a steady growth in residential, commercial, and industrial development. Yet, thanks to your continued conservation efforts, our overall water demand and production has remained at a fairly consistent level over the last several years.
Our Butterfield and West Pasco Water Treatment Plants enable the City to meet current and future water demand. Current treatment capacity is 35 MGD, with the ability to treat up to 48 MGD when the West Pasco plant is expanded to its maximum capacity in the future. Current daily peak flows run between 5.0 MGD in the winter to more than 26 MGD during the summer. Annually, the City of Pasco withdraws approximately 5.0 billion gallons of water from the Columbia River.
The City of Pasco, along with most water systems in Washington, has embarked on a mandatory
Some of our methods and goals for this ongoing program include:
- Leak reduction in the system
- Providing water conservation devices to the public
- Water conservation education
- Per Capita reduction in usage
You can play a role in conserving water and saving yourself money in the process by becoming conscious of the amount of water your household is using and by looking for ways to use less whenever you can. It is not hard to conserve water.
Here are a few tips:
- Automatic dishwashers use 15 gallons for every cycle, regardless of how many dishes are loaded. So get the most for your money and load it to capacity.
- Turn off the tap when brushing your teeth.
- Check every faucet in your home for leaks. Just a slow drip can waste 15 to 20 gallons a day. Fix it and you can save almost 6,000 gallons per year.
- Check your toilets for leaks by putting a few drops of food coloring in the tank. Watch for a few minutes to see if the color shows up in the bowl. It is not uncommon to lose up to 100 gallons a day from an invisible toilet leak. Fix it and you save more than 30,000 gallons a year.
- Use your water meter to detect hidden leaks. Simply turn off all taps and water using appliances. Then check the meter after 15 minutes. If it moved, you have a leak.
Average water usage per person in a household, (without any leaks) is about 100 gallons every day.
Pasco Water Usage 2016 - 2020
5 |
Billion |
|
|
|
|
|
4 |
Billion |
4.73 |
4.57 |
4.81 |
4.84 |
5.09 |
|
|
Billion |
Billion |
Billion |
Billion |
|
|
|
Billion |
||||
3 |
Billion |
|
|
|
|
|
|
|
|
|
|
||
2 |
Billion |
|
|
|
|
|
1 |
Billion |
|
|
|
|
|
|
|
2016 |
2017 |
2018 |
2019 |
2020 |
Why provide a water quality report?
A source water assessment has been conducted for your water source, the Columbia River. The purpose of the assessment was to determine the susceptibility of the Columbia River
to potential contaminant sources and establish a relative susceptibility rating of high, moderate, or low.
The assessment reported a high susceptibility rating for the Columbia River. Please understand that this susceptibility rating does not imply poor water quality; rather, it signifies the system’s potential to becoming contaminated.
The source water assessment for the City of Pasco can be accessed on the internet through the Washington State Department of Health, Drinking Water Division, Web site at https://fortress.wa.gov/doh/swap/index.html
The sources of drinking water (both tap water and bottled water) include rivers, lakes, streams, ponds, reservoirs, springs, and wells. As water travels over the surface of the land or through the ground, it dissolves naturally occurring minerals and, in some cases, radioactive material, and can pick up substances resulting from the presence of animals or from human activity. Contaminants that may be present in source water include:
- Microbial contaminants, such as viruses and bacteria, which may come from sewage treatment plants, septic systems, agricultural livestock operations, wildlife, and domestic pets.
-
Inorganic contaminants, such as salts and metals, which can be
naturally-occurring or result from urban stormwater runoff, industrial or domestic wastewater discharges, oil and gas production, mining, or farming. - Pesticides and herbicides, which may come from a variety of sources such as agriculture, urban stormwater runoff, and residential uses.
- Organic chemical contaminants, including synthetic and volatile organic chemicals, which are byproducts of industrial processes and petroleum production, and can also come from gas stations, urban stormwater runoff, and septic systems.
-
Radioactive contaminants, which can be
naturally-occurring or be the result of oil and gas production and mining activities.
In order to ensure that tap water is safe to drink, EPA prescribes regulations which limit the amount of certain contaminants in water provided by public water systems. Environmental Protection Agency regulations establish limits for contaminants in bottled water which must provide the same protection for public health.
Contaminants
Pasco Water Department
EWG's drinking water quality report shows results of tests conducted by the water utility and provided to the Environmental Working Group by the Washington State Department of Health, as well as information from the U.S. EPA Enforcement and Compliance History database (ECHO). For the latest quarter assessed by the U.S. EPA (January 2019 - March 2019), tap water provided by this water utility was in compliance with federal health-based drinking water standards.
Utility details
- Serves: 68648
- Data available: 2012-2017
- Data Source: Surface water
- Total: 18
Contaminants That Exceed Guidelines
- Bromodichloromethane
- Chloroform
- Chromium (hexavalent)
- Dichloroacetic acid
- Nitrate
- Nitrate and nitrite
- Total trihalomethanes (TTHMs)
- Trichloroacetic acid
Other Detected Contaminants
- Barium
- Bromochloroacetic acid
- Chlorate
- Dibromochloromethane
- Fluoride
- Haloacetic acids (HAA5)
- Molybdenum
- Monochloroacetic acid
- Strontium
- Vanadium
Reminder
Always take extra precautions, the water may be safe to drink when it leaves the sewage treatment plant but it may pick up pollutants during its way to your tap. We advise that you ask locals or hotel staff about the water quality. Also, note that different cities have different water mineral contents.