Table of Contents
Can You Drink Tap Water in Lillington?
Yes, Lillington's tap water is generally considered safe to drink as Lillington has no active health based violations of the Safe Drinking Water Act (SDWA) that we are aware of. Other factors such as lead piping in a home, or low levels of pollutants on immunocompromised individuals, should also be considered, however. To find more recent info we might have, you can check out our boil water notice page or the city's water provider website.
According the EPA’s ECHO database, from April 30, 2019 to June 30, 2022, Lillington's water utility, Harnett Regional Water, had 0 violations of the Safe Drinking Water Act. For more details on the violations, please see our violation history section below. The last violation for Lillington was resolved on April 30, 2015. This assessment is based on the Harnett Regional Water water system, other water systems in the city may have different results.
While tap water that meets the EPA health guidelines generally won’t make you sick to your stomach, it can still contain regulated and unregulated contaminants present in trace amounts that could potentially cause health issues over the long-run. These trace contaminants may also impact immunocompromised and vulnerable individuals.
The EPA is reviewing if it’s current regulations around pollutant levels in tap water are strict enough, and the health dangers posed by unregulated pollutants, like PFAS.
Water Quality Report for Lillington Tap Water
The most recent publicly available numbers for measured contaminant levels in Lillington tap water are in its 2020 Water Quality Report. As you can see, there are levels which the EPA considers to be acceptable, but being below the maximum allowable level doesn’t necessarily mean the water is healthy.
Lead in tap water, for example, is currently allowed at up to 15ppb by the EPA, but it has set the ideal goal for lead at zero. This highlights how meeting EPA standards doesn’t necessarily mean local tap water is healthy.
EPA regulations continue to change as it evaluates the long term impacts of chemicals and updates drinking water acceptable levels. The rules around arsenic, as well as, lead and copper are currently being re-evaluated.
There are also a number of "emerging" contaminants that are not currently. For example, PFAS (Per- and polyfluoroalkyl substances), for which the EPA has issued a health advisory. PFAS are called "forever chemicals" since they tend not to break down in the environment or the human body and can accumulate over time.
We recommend looking at the contaminants present in Lillington's water quality reports, or getting your home's tap water tested to see if you should be filtering your water.
Lillington Tap Water Safe Drinking Water Act Violation History - Prior 10 Years
Below is a ten year history of violations for the water system named Harnett Regional Water for Lillington in North Carolina. For more details please see the "What do these Violations Mean?" section below.
From April 1, 2015 to April 30, 2015, Lillington had 1 non-health based Safe Drinking Water Act violation with the violation category being Monitoring and Reporting, more specifically, the violation code was Monitoring, Turbidity (Enhanced SWTR) which falls into the Microbials rule code group, and the Surface Water Treatment Rules rule code family for the following contaminant code: Interim Enhanced Surface Water Treatment Rule.
Is there Lead in Lillington Water?
Based on the EPA’s ECHO Database, 90% of the samples taken from the Lillington water system, Harnett Regional Water, between sample start date and sample end date, were at or below, 0.0 mg/L of lead in Lillington water. This is 0% of the 0.015 mg/L action level. This means 10% of the samples taken from Lillington contained more lead.
While Lillington water testing may have found 0.0 mg/L of lead in its water, that does not mean your water source has the same amount. The amount of lead in water in a city can vary greatly from neighborhood to neighborhood, or even building to building. Many buildings, particularly older ones, have lead pipes or service lines which can be a source of contamination. To find out if your home has lead, we recommend getting you water tested.
No amount of lead in water is healthy, only less dangerous. As lead accumulates in our bodies over time, even exposure to relatively small amounts can have negative health effects. For more information, please check out our Lead FAQ page.
Are there PFAS in Lillington Tap Water?
Currently, testing tap water for PFAS isn’t mandated on a national level. We do have a list of military bases where there have been suspected or confirmed leaks. There appears to be at least one military base - Fort Bragg - near Lillington with suspected leaks.
With many potential sources of PFAS in tap water across the US, the best information we currently have about which cities have PFAS in their water is this ewg map, which you can check to see if Lillington has been evaluated for yet.
Our stance is better safe than sorry, and that it makes sense to try to purify the tap water just in case.
Lillington SDWA Violation History Table - Prior 10 Years
| Compliance Period | Status | Health-Based? | Category Code | Code | Rule Code | Contaminant Code | Rule Group Code | Rule Family Code |
|---|---|---|---|---|---|---|---|---|
| 04/01/2015 - 04/30/2015 | Resolved | No | Monitoring and Reporting (MR) | Monitoring, Turbidity (Enhanced SWTR) (38) | Long Term 1 Enhanced Surface Water Treatment Rule (122) | Interim Enhanced Surface Water Treatment Rule (0300) | Microbials (100) | Surface Water Treatment Rules (120) |
What do these Violations Mean?
Safe Drinking Water Act Violations categories split into two groups, health based, and non-health based. Generally, health based violations are more serious, though non-health based violations can also be cause for concern.
Health Based Violations
- Maximum contaminant levels (MCLs) - maximum allowed contaminant level was exceeded.
- Maximum residual disinfectant levels (MRDLs) - maximum allowed disinfectant level was exceeded.
- Other violations (Other) - the exact required process to reduce the amounts of contaminants in drinking water was not followed.
Non-Health Based Violations
- Monitoring and reporting violations (MR, MON) - failure to conduct the required regular monitoring of drinking water quality, and/or to submit monitoring results on time.
- Public notice violations (Other) - failure to immediately alert consumers if there is a serious problem with their drinking water that may pose a risk to public health.
- Other violations (Other) - miscellaneous violations, such as failure to issue annual consumer confidence reports or maintain required records.
SDWA Table Key
| Field | Description |
|---|---|
| Compliance Period | Dates of the compliance period. |
| Status |
Current status of the violation.
|
| Health-Based? | Whether the violation is health based. |
| Category Code |
The category of violation that is reported.
|
| Code | A full description of violation codes can be accessed in the SDWA_REF_CODE_VALUES (CSV) table. |
| Contaminant Code | A code value that represents a contaminant for which a public water system has incurred a violation of a primary drinking water regulation. |
| Rule Code |
Code for a National Drinking Water rule.
|
| Rule Group Code |
Code that uniquely identifies a rule group.
|
| Rule Family Code |
Code for rule family.
|
For more clarification please visit the EPA's data dictionary.
Lillington Water - Frequently Asked Questions
| By Mail: | P.O BOX 1119 LILLINGTON, NC, 27546 |
Existing customers can login to their Harnett Regional Water account to pay their Lillington water bill by clicking here.
If you want to pay your Harnett Regional Water bill online and haven't made an account yet, you can create an account online. Please click here to create your account to pay your Lillington water bill.
If you don't want to make an account, or can't remember your account, you can make a one-time payment towards your Lillington water bill without creating an account using a one time payment portal with your account number and credit or debit card. Click here to make a one time payment.
Moving to a new house or apartment in Lillington means you will often need to put the water in your name with Harnett Regional Water. In order to put the water in your name, please click the link to the start service form below. Start service requests for water bills typically take two business days.
Leaving your house or apartment in Lillington means you will likely need to take your name off of the water bill with Harnett Regional Water. In order to take your name off the water bill, please click the link to the stop service form below. Stop service for water bills requests typically take two business days.
USER SUBMITTED RATINGS
- Drinking Water Pollution and Inaccessibility
- Water Pollution
- Drinking Water Quality and Accessibility
- Water Quality
The above data is comprised of subjective, user submitted opinions about the water quality and pollution in Lillington, measured on a scale from 0% (lowest) to 100% (highest).
Related FAQS
Lillington Water Quality Report (Consumer Confidence Report)
The EPA mandates that towns and cities consistently monitor and test their tap water. They must report their findings in an annual Consumer Confidence Report. Below is the most recent water quality report from Lillington's Water. If you would like to see the original version of the report, please click here.
Water Quality Report 2020: Drinking Water Analysis
Harnett County Regional WTP (PWS ID#
We are pleased to present to you this year’s Annual Drinking Water Quality Report. This report is a snapshot of last year’s water quality. Included are details about from where your water comes, what it contains, and how it compares to standards set by regulatory agencies. Our constant goal is to provide you with a safe and dependable supply of drinking water. We want you to understand the efforts we make to continually improve the water treatment process and protect our water resources. We are committed to ensuring the quality of your water and to providing you with this information, because informed customers are our best allies. If you have questions about this report or concerning your water, please contact Tracy Tant,
What EPA Wants You to Know
Drinking water, including bottled water, may reasonably be expected to contain at least small amounts of some contaminants. The presence of contaminants does not necessarily indicate that water poses a health risk. More information about contaminants and potential health effects can be obtained by calling the Environmental Protection Agency’s Safe Drinking Water Hotline
Some people may be more vulnerable to contaminants in drinking water than the general population. Immunocompromised persons such as persons with cancer undergoing chemotherapy, persons who have undergone organ transplants, people with HIV/AIDS or other immune system disorders, some elderly, and infants can be particularly at risk from infections. These people should seek advice about drinking water from their health care providers. EPA/CDC guidelines on appropriate means to lessen the risk of infection by Cryptosporidium and other microbiological contaminants are available from the Safe Drinking Water Hotline
If present, elevated levels of lead can cause serious health problems, especially for pregnant women and young children. Lead in drinking water is primarily from materials and components associated with service lines and home plumbing. Harnett County is responsible for providing high quality drinking water, but cannot control the variety of materials used in plumbing components. When your water has been sitting for several hours, you can minimize the potential for lead exposure by flushing your tap for 30 seconds to 2 minutes before using water for drinking or cooking. If you are concerned about lead in your water, you may wish to have your water tested. Information on lead in drinking water, testing methods, and steps you can take to minimize exposure is available from the Safe Drinking Water Hotline or at http://www.epa.gov/safewater/lead.
The sources of drinking water (both tap water and bottled water) include rivers, lakes, streams, ponds, reservoirs, springs, and wells. As water travels over the surface of the land or through the ground, it dissolves
Contaminants that may be present in source water include microbial contaminants, such as viruses and bacteria, which may come from sewage treatment plants, septic systems, agricultural livestock operations, and wildlife; inorganic contaminants, such as salts and metals, which can be
In order to ensure that tap water is safe to drink, EPA prescribes regulations, which limit the amount of certain contaminants in water provided by public water systems. FDA regulations establish limits for contaminants in bottled water, which must provide the same protection for public health.
When You Turn on Your Tap, Consider the Source
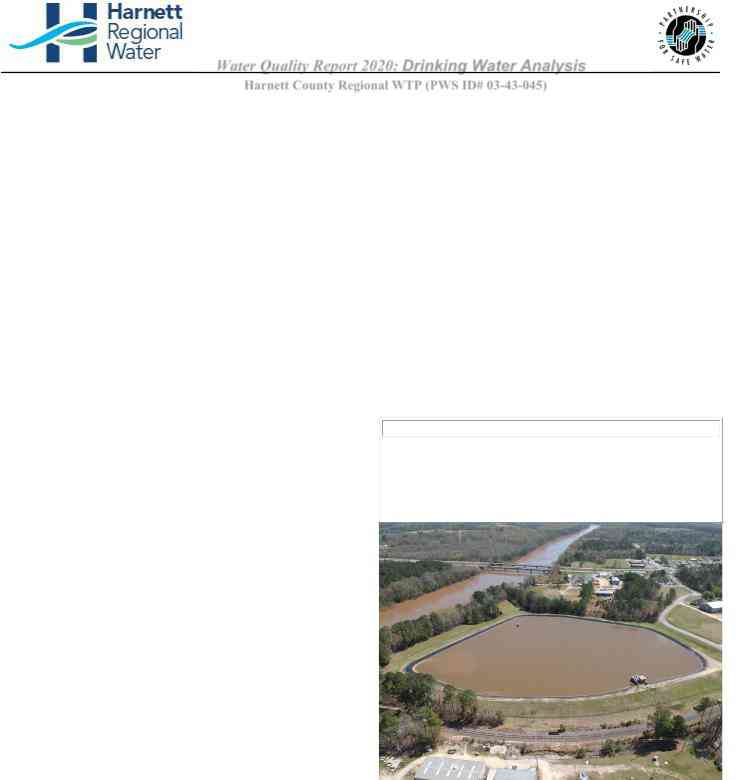
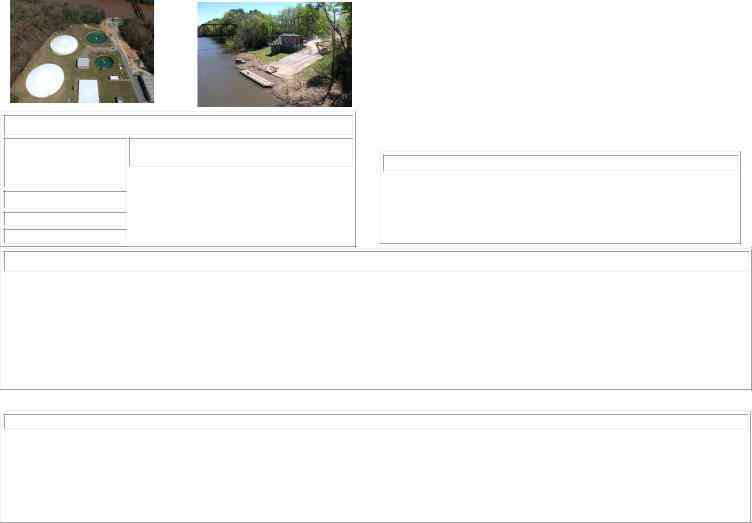
The Water that is used by this system comes from the Cape Fear River, which is formed by the confluence of the Deep, and Haw River along the border between Chatham and Lee counties. We are a surface water treatment plant located at 310 West Duncan St. in Lillington NC.
Source Water Assessment Program (SWAP) Results
The North Carolina Department of Environment Quality (DEQ), Public Water Supply (PWSS) Section, Source Water Assessment Program (SWAP) conducted assessments for all drinking water sources across North Carolina. The purpose of the assessment was to determine the susceptibility of each drinking water source (well or surface water intake) to Potential Contaminant Sources (PCSs).
The relative susceptibility rating for Harnett Regional Water (HRW) was determined by combining the contaminant rating (number and locations of PCSs within the assessment area) and the inherent vulnerability rating (i.e., characteristics or existing conditions of watershed and its delineated assessment area.) The assessment findings are summarized in the table below.
SWAP Result Summary
Source Name |
|
Susceptibility Rating |
|
SWAP Report Date |
|
|
|
|
|
|
|
|
|
|
CAPE FEAR RIVER |
|
Moderate |
|
Aug 31, 2017 |
|
|
|
|
|
DUNN/CAPE FEAR |
|
Higher |
|
Aug 31, 2017 |
RIVER |
|
|
|
|
|
|
|
|
|
|
|
|
|
|
Harnett Regional Water – Water Treatment Plant Reservoir
The Complete SWAP Assessment report for Harnett Regional Water may be viewed on the website: https://www.ncwater.org/?page=600 Note that because SWAP results and reports are periodically updated by the PWS section, the results may differ from the results on the CCR. To obtain a printed copy of this report, please mail a written request to: Source Water Assessment Program - Report Request, 1634 Mail Service Center, Raleigh NC
It is important to understand that a susceptibility rating of “higher” does not imply poor water quality, only the systems’ potential to become contaminated by PCS’s in the assessment area.
Director’s Corner |
Additional Information |
|
.
2020 was a definitely a year that everyone wants to put in the rear view mirror. The
We are very proud of our record of environmental compliance as evidenced by this water quality report. We did not have any water quality violations and produced excellent water for our customers as always. Contact us by email or phone to get your water treatment questions answered. HRW is very fortunate to have such a fine group of water treatment professionals who strive daily to provide only the best drinking water to all of our citizens. HRW will continue to serve the citizens of Harnett County and the surrounding region by supplying only the best of the most important commodity in the world, water.
Step 1 TOC Removal Requirements
The Harnett County Regional Water Treatment Plant does voluntary quarterly monitoring of its source water for cryptosporidium. Cryptosporidium is a microbial parasite, which is found in surface water throughout the United States. Our Monitoring for 2020 had zero detects. Cryptosporidium must be ingested for it to cause disease and may be spread through means other than drinking water. Contact the Safe/Drinking Water Hotline at
PPM
MCLG – Maximum Contaminant Level Goal
MCL – Maximum Contaminant Level
SMCL – Secondary Maximum Contaminant Level
- – Treatment Technique AL – Action Level
NTU – Nephelometric Turbidity Unit ND –
MCLG – Maximum Contaminant Level Goal – The level of a contaminant in drinking water below which there is no known or expected health risk. MCLGs allow for a margin of safety.
MCL – Maximum Contaminant Level – The highest level of a contaminant that is allowed in drinking water. MCLs are set as close to MCLGs as feasible using the best available Treatment technology.
-
– Treatment Technique – is a required process intended to reduce the level of contaminant in drinking water.
AL – Action Level – The concentration of a contaminant which, if exceeded triggers treatment or other requirements which a water system must follow.
MFL-Million Fibers per Liter- A measurement of the presence of asbestos fibers that are longer than 10 micrometers
LRAA – Locational Running Annual Average – The average of sample analytical results for samples taken at a particular monitoring location during the previous four calendar quarters under the Stage 2 Disinfectants and Disinfection Byproducts Rule
Source Water
TOC (Mg/L)
>2.0 – 4.0
>4.0 – 8.0
> 8.0
Source Water Alkalinity Mg/L as CaCO3 ( in
Percentages)
|
|
>120 |
||
|
|
|
|
|
35.0 |
25.0 |
15.0 |
||
|
|
|
|
|
45.0 |
35.0 |
25.0 |
||
|
|
|
|
|
50.0 |
40.0 |
30.0 |
Misc. Water Characteristics Contaminants
Contaminant (units) |
|
Sample Date |
|
Your Water |
|
Secondary |
|
|
|
MCL |
|||
|
|
|
|
|
|
|
pH |
|
|
7.6 |
|
6.5 to 8.5 |
|
|
|
|
|
|
|
|
Sulfate (ppm) |
|
|
44.1 |
|
250 |
|
|
|
|
|
|||
|
|
|
|
|
|
|
Sodium (ppm) |
|
22.69 |
|
NA |
||
Turbidity
Turbidity (NTU) |
|
Treatment Technique |
|
Your Water |
|
|
Treatment Technique (TT) |
|
Likely Source |
|
|
(TT) Violation Y/N |
|
|
|
|
Violation if : |
|
|
|
|
|
|
|
|
|
|
|
|
Highest single measurement |
|
N |
|
0.04 |
|
|
Turbidity > 1 NTU |
|
|
|
|
|
|
|
|
|
|
|
Soil runoff |
Lowest monthly percentage |
|
|
|
|
|
|
Less than 95% of monthly Turbidity |
|
|
of samples meeting turbidity |
|
N |
|
100% |
|
|
|
|
|
|
|
|
|
measurements are ≤ 0.3 NTU |
|
|
|||
limits |
|
|
|
|
|
|
|
|
|
|
|
|
|
|
|
|
|
|
|
|
|||||||||
Turbidity is a measure of the cloudiness of the water. We monitor it because it is a good indicator of the effectiveness of our filtration system. The turbidity rule requires that 95% or more of the monthly samples must be less |
|||||||||
|
|
|
|
|
than or equal to 0.3 NTU |
|
|
||
Microbiological Contaminants
Contaminant [code] (units) |
|
MCL |
|
MCLG |
|
Your |
|
MCL |
|
Likely Source of |
|
|
|
|
|
|
Water |
|
Violation |
|
Contamination |
|
|
|
|
|
|
|
|
|
|
|
Total Coliform Bacteria (presence or absence) |
|
> 5 % triggers level 1 assessment |
|
N/A |
|
3.0% |
|
N |
|
Naturally present in the |
|
|
|
|
|
environment |
|||||
|
|
|
|
|
|
|
|
|
|
|
|
|
Routine and repeat samples are total |
|
|
|
|
|
|
|
|
|
|
following E. |
|
|
|
|
|
|
|
Human and Animal Fecal |
Fecal Coliform or E. coli (presence or absence) |
|
|
|
0 |
|
0% |
|
N |
|
|
|
|
|
|
|
|
Waste |
||||
|
|
|
|
|
|
|
|
|
|
|
|
|
Note: If either an original routine sample and/or its repeat samples(s) are E. coli positive, a Tier 1 violation exists. |
|
|
|
|
|
|
|
|
Coliforms are bacteria that are naturally present in the environment and are used as an indicator that other, potentially harmful, waterborne pathogens may be present or that a potential pathway exists through which contamination may enter the drinking water distribution system.
Regulated Inorganic Contaminants
Contaminant [code] (units) |
|
MCL |
|
MCLG |
|
Your Water |
|
Range |
|
Date of Sample |
|
Violation |
|
Likely Source of Contamination |
|
|
|
|
|
|
|
|
|
|
|
|
|
|
|
Fluoride (ppm) |
|
4 |
|
4 |
|
0.75 |
|
N/A |
|
1/9/20 |
|
N |
|
Erosion of natural deposits; Water additive which promotes strong teeth; Discharge from fertilizer |
|
|
|
|
|
|
|
and aluminum factories |
|||||||
|
|
|
|
|
|
|
|
|
|
|
|
|
|
|
Lead and Copper Contaminants
Contaminant [code] (units) |
|
MCL |
|
MCLG |
|
Your Water |
|
Range |
|
Date of Sample |
|
Violation |
|
Likely Source of Contamination |
|
|
|
|
|
|
|
|
|
|
|
|
|
|
|||
Copper (ppm) |
90th Percentile |
|
AL=1.3 |
|
1.3 |
|
0.097 |
|
N/A |
|
|
N |
|
Corrosion of household plumbing systems; erosion of natural deposits; leaching from wood |
|
|
|
|
|
|
|
|
|
|
|
|
|
|
|
|
preservatives |
|
|
|
|
|
|
|
|
|
|
|
|
|
|
|
|
Lead (ppb) |
90th Percentile |
|
AL=15 |
|
0 |
|
N/D |
|
N/A |
|
|
N |
|
Corrosion of household plumbing systems, erosion of natural deposits |
|
|
|
|
|
|
|
|
|
|
|
|
|
|
|
|
|
Disinfection Residuals Summary
|
|
|
|
|
|
|
|
Your Water |
|
Range |
|
MRDL |
|
|
Contaminant |
|
YEAR |
|
MRDL |
|
MRDLG |
|
|
Individual |
|
|
Likely Source of Contamination |
||
|
|
|
|
LRAA |
|
|
Violation |
|
||||||
|
|
|
|
|
|
|
|
|
Results |
|
|
|
||
|
|
|
|
|
|
|
|
|
|
|
|
|
|
|
|
|
|
|
|
|
|
|
|
|
|
|
|
|
|
Chlorine Dioxide (ppb) |
2020 |
800 |
800 |
22.0 |
0 - 237 |
|
N |
|
Water additive used to control microbes |
|||||
|
|
|
|
|
|
|
|
|
|
|
|
|
|
|
Chloramines (ppm) |
2020 |
4 |
4 |
2.85 |
|
1.10 – 4.50 |
|
N |
|
Water additive used to control microbes |
||||
|
|
|
|
|
|
|
|
|
|
|||||
.Chlorine (only month of March)(ppm) |
|
2020 |
|
4 |
|
4 |
|
1.75 |
|
0.20- 2.90 |
|
N |
|
Water additive used to control microbes |
Disinfection
Contaminant (units) |
|
TT Violation Y/N |
|
Your Water Ratio |
|
Range Ratio |
|
MCLG |
|
MCL |
|
Likely Source of Contamination |
|
Compliance Method |
|
|
|
|
|
|
|
|
|
|
|
|
|
|
|
|
|
|
|
|
|
|
|
|
|
|
|
|
|
|
Total Organic Carbon (Ratio) |
|
N |
|
1.43 |
|
1.33 – 1.53 |
|
N/A |
|
TT |
|
Naturally present in the environment |
|
Step 1 |
|
|
|
|
|
|
|
|
|
|
|
|
|
|
|
Disinfection
|
|
|
|
|
|
|
|
Your Water |
|
Range |
|
|
|
|
|
Contaminant |
|
YEAR |
|
MCL |
|
MCLG |
|
|
Individual |
|
Violation |
|
Likely Source of Contamination |
||
|
|
|
|
Highest LRAA |
|
|
|
||||||||
|
|
|
|
|
|
|
|
|
Results |
|
|
|
|
||
|
|
|
|
|
|
|
|
|
|
|
|
|
|
|
|
TTHM (ppb) |
|
2020 |
|
80 |
|
N/A |
|
38.2 |
|
|
|
|
N |
|
|
|
|
|
|
|
|
|
|
|
|
|
|
|
|
|
|
TTHM (ppb) B01 |
2020 |
80 |
|
N/A |
|
|
19.9 |
– 39.6 |
|
N |
|
||||
|
|
|
|
|
|
|
|
|
|
|
|
|
|||
TTHM (ppb) B02 |
|
2020 |
|
80 |
|
N/A |
|
|
|
21.4 |
– 40.8 |
|
N |
|
|
|
|
|
|
|
|
|
|
|
|
|
|
|
|||
TTHM (ppb) B03 |
|
2020 |
|
80 |
|
N/A |
|
|
|
17.1 |
– 28.6 |
|
N |
|
|
|
|
|
|
|
|
|
|
|
|
|
|
|
|
|
|
TTHM (ppb) B04 |
2020 |
80 |
|
N/A |
|
|
15.7 |
– 48.7 |
|
N |
|
||||
|
|
|
|
|
|
|
|
|
|
|
|
|
|
|
|
TTHM (ppb) B05 |
2020 |
80 |
|
N/A |
|
|
22.2 |
– 42.6 |
|
N |
|
||||
|
|
|
|
|
|
|
|
|
|
|
|
|
|||
TTHM (ppb) B06 |
|
2020 |
|
80 |
|
N/A |
|
|
|
21.5 |
– 40.6 |
|
N |
|
|
|
|
|
|
|
|
|
|
|
|
|
|
|
|
|
|
TTHM (ppb) B07 |
2020 |
80 |
|
N/A |
|
|
|
20.0 – 37.4 |
|
N |
|
||||
|
|
|
|
|
|
|
|
|
|
|
|
|
|||
TTHM (ppb) B08 |
|
2020 |
|
80 |
|
N/A |
|
|
|
20.3 |
– 43.9 |
|
N |
|
|
|
|
|
|
|
|
|
|
|
|
|
|
|
|||
HAA5 (ppb) |
|
2020 |
|
60 |
|
N/A |
|
23.7 |
|
|
|
|
N |
|
|
|
|
|
|
|
|
|
|
|
|
|
|
|
|||
HAA5 (ppb) B01 |
|
2020 |
|
60 |
|
N/A |
|
|
|
13.8 |
– 22.7 |
|
N |
|
|
|
|
|
|
|
|
|
|
|
|
|
|
|
|||
HAA5 (ppb) B02 |
|
2020 |
|
60 |
|
N/A |
|
|
|
17.4 |
– 28.6 |
|
N |
|
|
|
|
|
|
|
|
|
|
|
|
|
|
|
|||
HAA5 (ppb) B03 |
|
2020 |
|
60 |
|
N/A |
|
|
|
12.9 |
– 19.1 |
|
N |
|
|
|
|
|
|
|
|
|
|
|
|
|
|
|
|||
HAA5 (ppb) B04 |
|
2020 |
|
60 |
|
N/A |
|
|
|
17.7 |
– 30.2 |
|
N |
|
|
|
|
|
|
|
|
|
|
|
|
|
|
|
|||
HAA5 (ppb) B05 |
|
2020 |
|
60 |
|
N/A |
|
|
|
14.1 |
– 19.3 |
|
N |
|
|
|
|
|
|
|
|
|
|
|
|
|
|
|
|
|
|
HAA5 (ppb) B06 |
2020 |
60 |
|
N/A |
|
|
14.0 |
– 17.6 |
|
N |
|
||||
|
|
|
|
|
|
|
|
|
|
|
|
|
|
|
|
HAA5 (ppb) B07 |
2020 |
60 |
|
N/A |
|
|
12.6 |
– 19.6 |
|
N |
|
||||
|
|
|
|
|
|
|
|
|
|
|
|
|
|||
HAA5 (ppb) B08 |
|
2020 |
|
60 |
|
N/A |
|
|
|
14.3 |
– 23.7 |
|
N |
|
|
|
|
|
|
|
|
|
|
|
|
|
|||||
CHLORITE (ppm) |
|
2020 |
|
1.0 |
|
0.8 |
|
0.402 |
|
0.347 |
– 0.450 |
|
N |
|
|
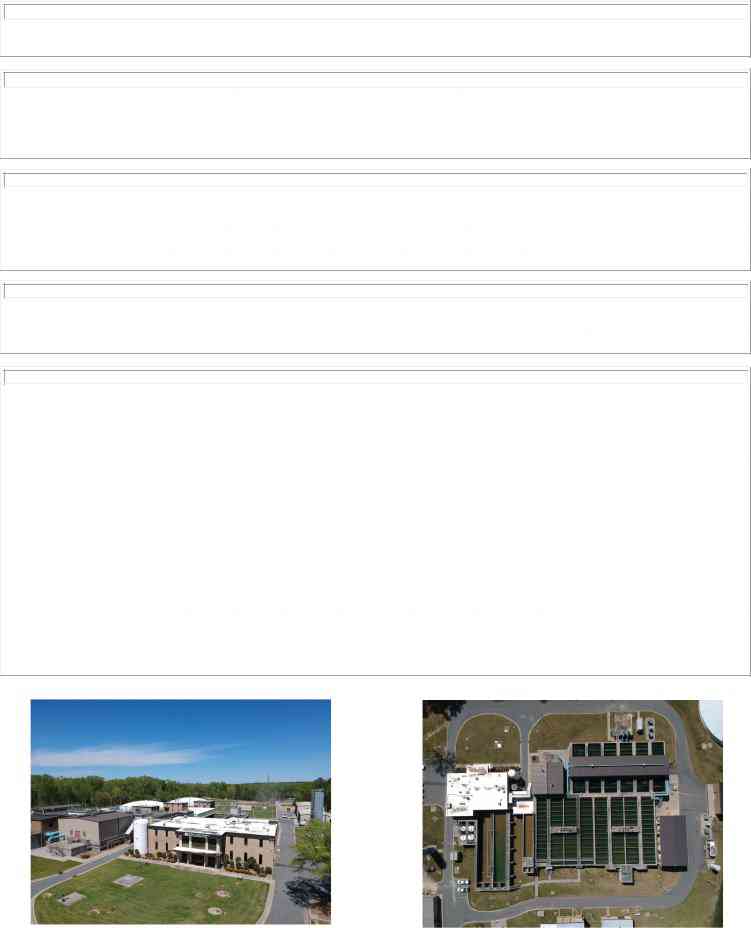
Harnett Regional Water Plant |
Harnett Regional Water Plant – Birds Eye View |
Contaminants
Harnett County Department of Public Utilities
EWG's drinking water quality report shows results of tests conducted by the water utility and provided to the Environmental Working Group by the North Carolina Department of Environment and Natural Resources, as well as information from the U.S. EPA Enforcement and Compliance History database (ECHO). For the latest quarter assessed by the U.S. EPA (January 2019 - March 2019), tap water provided by this water utility was in compliance with federal health-based drinking water standards.
Utility details
- Serves: 90004
- Data available: 2012-2017
- Data Source: Surface water
- Total: 22
Contaminants That Exceed Guidelines
- 1%2C4-Dioxane
- Bromodichloromethane
- Bromoform
- Chlorite
- Chloroform
- Chromium (hexavalent)
- Dibromochloromethane
- Dichloroacetic acid
- Perfluoroheptanoic acid (PFHPA)
- Perfluorooctanoic acid (PFOA)
- Total trihalomethanes (TTHMs)
- Trichloroacetic acid
Other Detected Contaminants
- Chlorate
- Dibromoacetic acid
- Fluoride
- Haloacetic acids (HAA5)
- Manganese
- Molybdenum
- Monobromoacetic acid
- Monochloroacetic acid
- Strontium
- Vanadium
Reminder
Always take extra precautions, the water may be safe to drink when it leaves the sewage treatment plant but it may pick up pollutants during its way to your tap. We advise that you ask locals or hotel staff about the water quality. Also, note that different cities have different water mineral contents.