Table of Contents
Can You Drink Tap Water in Fall River?
Yes, Fall River's tap water is generally considered safe to drink as Fall River has no active health based violations of the Safe Drinking Water Act (SDWA) that we are aware of. Other factors such as lead piping in a home, or low levels of pollutants on immunocompromised individuals, should also be considered, however. To find more recent info we might have, you can check out our boil water notice page or the city's water provider website.
According the EPA’s ECHO database, from April 30, 2019 to June 30, 2022, Fall River's water utility, Fall River Water Department, had 0 violations of the Safe Drinking Water Act. For more details on the violations, please see our violation history section below. This assessment is based on the Fall River Water Department water system, other water systems in the city may have different results.
While tap water that meets the EPA health guidelines generally won’t make you sick to your stomach, it can still contain regulated and unregulated contaminants present in trace amounts that could potentially cause health issues over the long-run. These trace contaminants may also impact immunocompromised and vulnerable individuals.
The EPA is reviewing if it’s current regulations around pollutant levels in tap water are strict enough, and the health dangers posed by unregulated pollutants, like PFAS.
Water Quality Report for Fall River Tap Water
The most recent publicly available numbers for measured contaminant levels in Fall River tap water are in its 2020 Water Quality Report. As you can see, there are levels which the EPA considers to be acceptable, but being below the maximum allowable level doesn’t necessarily mean the water is healthy.
Lead in tap water, for example, is currently allowed at up to 15ppb by the EPA, but it has set the ideal goal for lead at zero. This highlights how meeting EPA standards doesn’t necessarily mean local tap water is healthy.
EPA regulations continue to change as it evaluates the long term impacts of chemicals and updates drinking water acceptable levels. The rules around arsenic, as well as, lead and copper are currently being re-evaluated.
There are also a number of "emerging" contaminants that are not currently. For example, PFAS (Per- and polyfluoroalkyl substances), for which the EPA has issued a health advisory. PFAS are called "forever chemicals" since they tend not to break down in the environment or the human body and can accumulate over time.
We recommend looking at the contaminants present in Fall River's water quality reports, or getting your home's tap water tested to see if you should be filtering your water.
Fall River Tap Water Safe Drinking Water Act Violation History - Prior 10 Years
Below is a ten year history of violations for the water system named Fall River Water Department for Fall River in Massachusetts. For more details please see the "What do these Violations Mean?" section below.
From Oct. 1, 2013 to Dec. 31, 2013, Fall River had 1 health-based Safe Drinking Water Act violation with the violation category being Maximum Contaminant Level Violation, more specifically, the violation code was Maximum Contaminant Level Violation, Average which falls into the Disinfectants and Disinfection Byproducts Rule rule code group, and the Stage 2 Disinfectants and Disinfection Byproducts Rule rule code family for the following contaminant code: TTHM.
Is there Lead in Fall River Water?
Based on the EPA’s ECHO Database, 90% of the samples taken from the Fall River water system, Fall River Water Department, between sample start date and sample end date, were at or below, 0.016 mg/L of lead in Fall River water. This is 106.7% of the 0.015 mg/L action level. This means 10% of the samples taken from Fall River contained more lead.
While Fall River water testing may have found 0.016 mg/L of lead in its water, that does not mean your water source has the same amount. The amount of lead in water in a city can vary greatly from neighborhood to neighborhood, or even building to building. Many buildings, particularly older ones, have lead pipes or service lines which can be a source of contamination. To find out if your home has lead, we recommend getting you water tested.
No amount of lead in water is healthy, only less dangerous. As lead accumulates in our bodies over time, even exposure to relatively small amounts can have negative health effects. For more information, please check out our Lead FAQ page.
Are there PFAS in Fall River Tap Water?
Currently, testing tap water for PFAS isn’t mandated on a national level. We do have a list of military bases where there have been suspected or confirmed leaks. There appears to be at least one military base - Rehoboth NG Site - near Fall River with suspected leaks.
With many potential sources of PFAS in tap water across the US, the best information we currently have about which cities have PFAS in their water is this ewg map, which you can check to see if Fall River has been evaluated for yet.
Our stance is better safe than sorry, and that it makes sense to try to purify the tap water just in case.
Fall River SDWA Violation History Table - Prior 10 Years
| Compliance Period | Status | Health-Based? | Category Code | Code | Rule Code | Contaminant Code | Rule Group Code | Rule Family Code |
|---|---|---|---|---|---|---|---|---|
| 10/01/2013 - 12/31/2013 | Archived | Yes | Maximum Contaminant Level Violation (MCL) | Maximum Contaminant Level Violation, Average (02) | Stage 2 Disinfectants and Disinfection Byproducts Rule (220) | TTHM (2950) | Disinfectants and Disinfection Byproducts Rule (200) | Stage 2 Disinfectants and Disinfection Byproducts Rule (220) |
What do these Violations Mean?
Safe Drinking Water Act Violations categories split into two groups, health based, and non-health based. Generally, health based violations are more serious, though non-health based violations can also be cause for concern.
Health Based Violations
- Maximum contaminant levels (MCLs) - maximum allowed contaminant level was exceeded.
- Maximum residual disinfectant levels (MRDLs) - maximum allowed disinfectant level was exceeded.
- Other violations (Other) - the exact required process to reduce the amounts of contaminants in drinking water was not followed.
Non-Health Based Violations
- Monitoring and reporting violations (MR, MON) - failure to conduct the required regular monitoring of drinking water quality, and/or to submit monitoring results on time.
- Public notice violations (Other) - failure to immediately alert consumers if there is a serious problem with their drinking water that may pose a risk to public health.
- Other violations (Other) - miscellaneous violations, such as failure to issue annual consumer confidence reports or maintain required records.
SDWA Table Key
| Field | Description |
|---|---|
| Compliance Period | Dates of the compliance period. |
| Status |
Current status of the violation.
|
| Health-Based? | Whether the violation is health based. |
| Category Code |
The category of violation that is reported.
|
| Code | A full description of violation codes can be accessed in the SDWA_REF_CODE_VALUES (CSV) table. |
| Contaminant Code | A code value that represents a contaminant for which a public water system has incurred a violation of a primary drinking water regulation. |
| Rule Code |
Code for a National Drinking Water rule.
|
| Rule Group Code |
Code that uniquely identifies a rule group.
|
| Rule Family Code |
Code for rule family.
|
For more clarification please visit the EPA's data dictionary.
Fall River Water - Frequently Asked Questions
| By Mail: | 1831 BEDFORD ST FALL RIVER, MA, 02723 |
Existing customers can login to their Fall River Water Department account to pay their Fall River water bill by clicking here.
If you want to pay your Fall River Water Department bill online and haven't made an account yet, you can create an account online. Please click here to create your account to pay your Fall River water bill.
If you don't want to make an account, or can't remember your account, you can make a one-time payment towards your Fall River water bill without creating an account using a one time payment portal with your account number and credit or debit card. Click here to make a one time payment.
Moving to a new house or apartment in Fall River means you will often need to put the water in your name with Fall River Water Department. In order to put the water in your name, please click the link to the start service form below. Start service requests for water bills typically take two business days.
Leaving your house or apartment in Fall River means you will likely need to take your name off of the water bill with Fall River Water Department. In order to take your name off the water bill, please click the link to the stop service form below. Stop service for water bills requests typically take two business days.
USER SUBMITTED RATINGS
- Drinking Water Pollution and Inaccessibility
- Water Pollution
- Drinking Water Quality and Accessibility
- Water Quality
The above data is comprised of subjective, user submitted opinions about the water quality and pollution in Fall River, measured on a scale from 0% (lowest) to 100% (highest).
Related FAQS
Fall River Water Quality Report (Consumer Confidence Report)
The EPA mandates that towns and cities consistently monitor and test their tap water. They must report their findings in an annual Consumer Confidence Report. Below is the most recent water quality report from Fall River's Water. If you would like to see the original version of the report, please click here.
WATER QUALITY REPORT
FOR BLOOMINGTON, MN • 2 0 2 0 TEST RESULTS
JUNE 2021
INSIDE
WQR 2 Where does your tap water come from?
WQR 3 FAQ.
WQR 4 2020 Water quality results.
MAKING SAFE
DRINKING WATER
The City of Bloomington works hard to provide you with high-
quality, safe, reliable drinking water that meets federal and state water quality requirements. This report contains information about the sources, treatment process and history of our water system. See PAGE WQR4 for the results of water quality monitoring on Bloomington’s water sources from January 1 to December 31, 2020, conducted by the Minnesota Department of Health, and laboratories operated by the cities of Bloomington and Minneapolis.
The goal of this report is to advance residents’ understanding of drinking water and heighten awareness of the need to protect precious water resources.
GET INVOLVED
Public Works welcomes input on water quality issues. Contact
the water quality supervisor at
If you have questions about your water or need assistance, call or visit the City’s website at
BLOOMINGTONMN.GOV.
-
Water Plant (24 hours a day)
952-563-4905.
Este informe contiene información muy importante. Si necesita una traducción del mismo, sírvase llamar al MN RELAY 711.
Ban bao cao nay co cac thong tin rat quan trong. Neu quy vi can ban dich tieng Viet, xin goi so MN RELAY 711.
Warbixintaan waxaa ku jira macluumaad aad muhiim u ah. Haddii aad u baahan tahay in laguu turjumo, fadlan la xiriir MN RELAY 711.
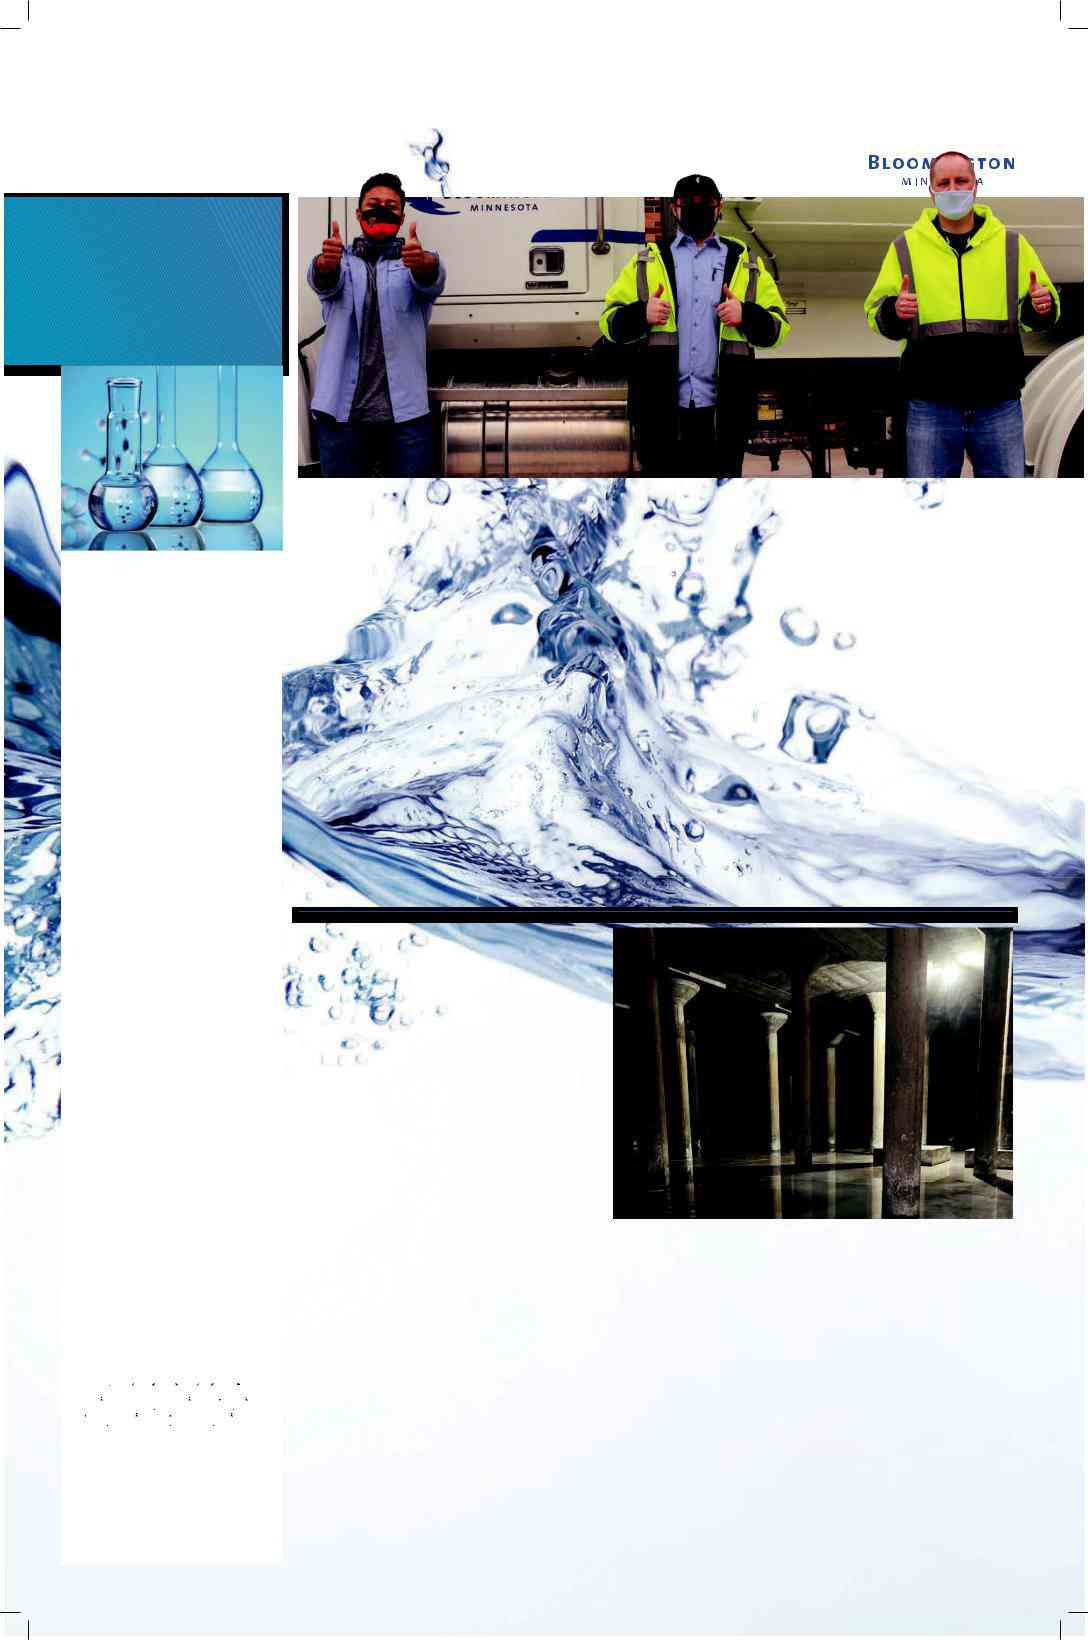
From left to right, Utility Operator Casey Lewis, Utility Operator Adam Meyer and Senior Utility Operator Anthony Hallberg give a thumbs up to the City’s
QUALITY WATER DELIVERED DESPITE PANDEMIC CHALLENGES
This past year was challenging for the City of Bloomington’s Utilities Division as well as for our customers. Hopefully, the worst of the pandemic is in the rearview mirror. Utilities staff have emerged from altered work flows and services with a more optimistic view for the future.
Due to pandemic restrictions and a significant decline in water sales, many of the Utilities Division’s services and normal operations were adjusted. Despite these changes, Utilities staff worked hard to provide the same
In addition to daily operations, crews performed routine inspections and preventative maintenance. They also responded to emergency repairs, such as water main breaks and service taps for new development.
Asset renewal projects continued with water distribution system replacements as part of the City’s Pavement Management Program and infrastructure rehabilitation at the Water Treatment Plant, which is necessary to continue to meet water demand and water quality requirements.
In 2020, the Utilities Division also completed a risk and resiliency assessment in compliance with America’s Water Infrastructure Act implemented by the Environmental Protection Agency. The risk and resiliency assessment updated and identified new potential risks to the water system, and evaluated capital and operation needs to maintain system resilience.
As normal conditions return in 2021, the Utilities Division is applying lessons learned in 2020 to make service delivery even more efficient and quality of services as high as possible while maintaining responsible water rates.
CLEARWELL CLEANING AND
INSPECTION KEEPS WATER SAFE
Did you know the City maintains 30 million gallons of drinking water storage at various sites?
Ongoing upkeep and maintenance lay the groundwork for Bloomington water to surpass state and federal requirements consistently.
In November 2019, the City of Bloomington’s Utilities Division hired a contractor to perform a dive inspection and cleaning project to evaluate a four-
In order to drain and enter the clearwell, the plant must shut down and rely on a wholesale connection with Minneapolis water to meet distribution needs. While planning, staff evaluated a
to clean and inspect the clearwell. That time of year typically brings lower daily distribution demand, so needs could be easily met through Minneapolis supply lines.
Throughout 2020, acquisition of fall protection equipment, personal protective devices and a fixed ladder to be mounted in the tank continued. Planning for the excavation and shoring of the area around the access hatch was also completed. The Bloomington Fire Department provided consultation on confined space entry procedures and how equipment should be positioned and anchored for safe access to the tank. A vacuum excavating contractor helped to remove accumulated spent lime sediment. After this step was completed, the removed material was transported to holding lagoons.
After five days of intense activity with an average of 10 people in the tank cleaning, rinsing and conveying sediment for disposal, the tank was ready for an inspection and condition assessment. Following the
The clearwell is in generally excellent condition. A rehabilitation
CITY OF BLOOMINGTON WATER QUALITY REPORT, JUNE 2021
THE SOURCES OF BLOOMINGTON’S TAP WATER
BLOOMINGTON |
MINNEAPOLIS |
|
|
|
|
|
|
|
|
|
|
|
Groundwater |
|
Surface water |
||||
|
|
|
|
|
|
|
|
|
|
|
treatment plant |
Mississippi |
treatment plant |
||||
|
|
|
Wells |
|
|
|
|||||||||||
|
|
|
|
|
|
|
|
|
|
|
|
|
|
River |
|
|
|
|
|
|
|
|
|
|
|
|
|
|
|
|
|
|
|
|
|
|
|
|
|
|
|
|
|
|
|
|
|
|
|
|
|
|
|
JORDAN AQUIFER
MT. SIMON AQUIFER
HOW MUCH WATER IS USED?
In 2020, residents and businesses in Bloomington used 3.4 billion gallons of water.
The chart below shows the peak day and average day of water use for each month during 2020, as well as the average amount of water treated at the City of Bloomington’s plant and purchased from Minneapolis. To get a more accurate picture of the actual water consumed, peak day data was adjusted to account for fluctuations in the City’s reservoir levels. To learn more, visit blm.mn/
BY THE NUMBERS
Numbers speak volumes, especially for the work the
Utilities Division does to support the City’s exemplary standards for quality water.
- Water storage facilities used by the City of Bloomington.
25,300 Water
service
accounts handled by the City for residential, commercial and multi- family customers.
9.4 |
Millions of gallons of |
water consumed, on |
BLOOMINGTON’S WATER SUPPLY
The City of Bloomington’s municipal water supply comes from two sources: Bloomington municipal water supply wells and an interconnection with the city of Minneapolis water supply system.
BLOOMINGTON WELLS
The City’s water plant draws water from deep groundwater wells. The wells extend into the Jordan Sandstone, Prairie du Chien Group, Tunnel
Sandstone and Mount Simon aquifers.
MISSISSIPPI RIVER
To supplement production at the water treatment plant, Bloomington purchases finished water from the city of Minneapolis. Treated water from our plant is blended with similarly treated water from Minneapolis throughout Bloomington’s distribution system. Minneapolis’ surface water treatment plant takes raw water
from the Mississippi River.
For more information, visit blm.mn/watertreatment.
2020 DAILY WATER USE
|
25 |
|
|
|
|
|
20 |
|
|
|
|
inmillions |
15 |
day |
|
|
|
10 |
|
Bloomington |
|||
Peak |
day |
||||
|
|
|
|||
Gallons |
|
Average |
supplied |
||
|
day |
|
|||
|
5 |
|
|||
|
Peak |
|
|||
|
|
|
|
||
|
|
Average day |
|||
0 Minneapolis supplied
Feb Apr Jun Aug Oct Dec
average, every day in 2020. |
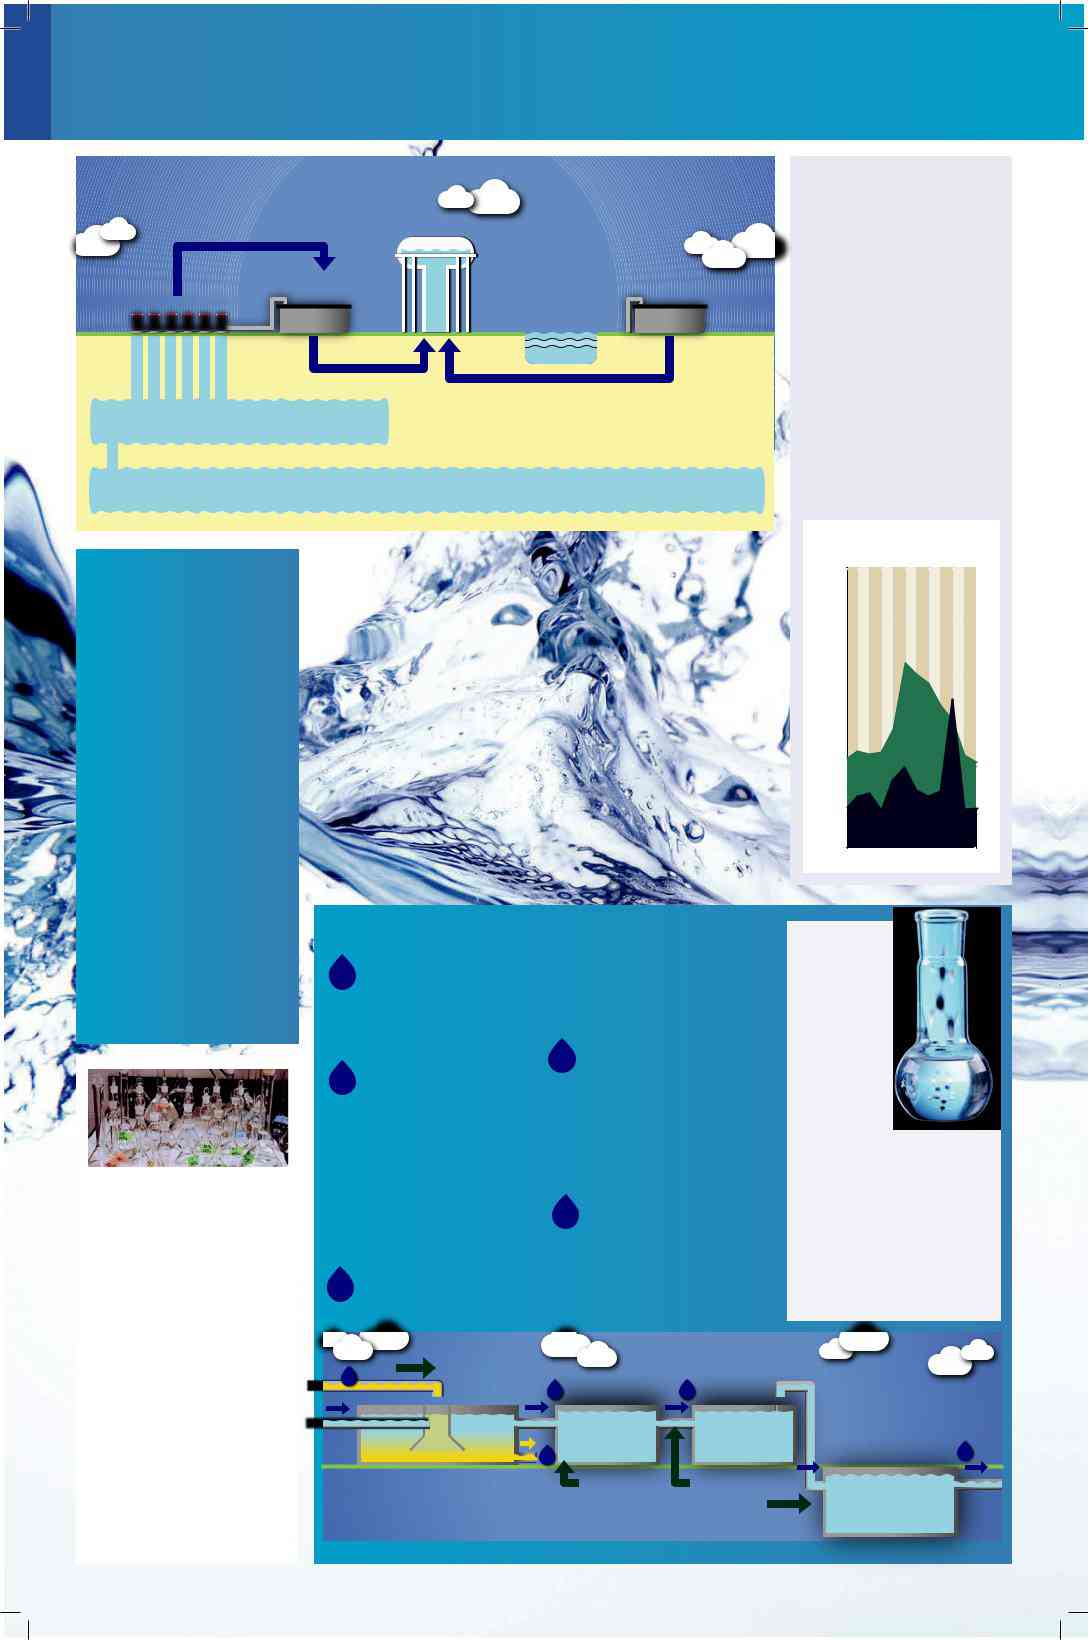
WATER TREATMENT PROCESS
WATER TESTING
30 |
Millions of gallons |
of storage capacity |
available in the City’s water distribution system.
CONSIDER A CAREER
IN THE WATER INDUSTRY
Working in this
difference in people’s lives and strengthens the quality of life in communities. Everyone needs clean,
1 |
The softening process begins |
when lime, in the form of |
slakenedquicklime, is mixed with raw water in one of the City’s two contact solids basins. Each basin holds half a million gallons of water.
2 |
The |
causes a chemical reaction |
|
that results in calcium and |
magnesium (the main components of hardness) forming insoluble particles called flocs. As these floc particles grow in size, they settle to the bottom of the contact solids basins. The solids are removed, dewatered and used as
a
3 |
The water enters a |
|
recarbonation basin where it |
||
|
is adjusted to the proper pH |
|
|
|
|
|
|
|
|
|
|
|
|
|
by adding carbon dioxide. A precise amount of chlorine is added to discourage bacterial growth as the water travels through the City’s distribution system.
- The water is filtered to remove any remaining particles. Then it enters an underground
reservoir called a clearwell where small quantities of fluoride are added. Because fluoride promotes strong teeth and bones, fluoridation is mandated by state law at a dosage of 0.7 parts per million. See page WQR 4.
- The finished water from the City’s treatment plant is pumped into the distribution
system, where it is mixed with treated water purchased from the city of Minneapolis. For more information, visit blm.mn/watertreatment.
The
William
Lloyd Analytical Laboratory is certified by the Minnesota Department of Health to test water.
In 2020, the
lab performed more than 9,660 tests on Bloomington’s well, raw, finished and distribution water. The lab also analyzed 161 state- mandated bacteria samples for new water main construction projects and conducted 937 water quality tests on Bloomington’s surface water bodies.
safe drinking water. There are other benefits in pursuing a career in the water industry. Placement rates for water environment technology professionals are higher than many other occupations and opportunities exist in both the public and private sectors.
For more information, visit the American Water Works Association Minnesota Section’s website at blm.mn/watercareers.
1 |
Lime |
|
|
|
|
|
|
|
|
|
|
|
3 |
4 |
|
|
|
|
|
|
|||
|
|
|
|
|
|
|
|
||||
|
|
|
|
|
|
|
|
|
|
|
|
Raw |
|
|
RECARBONATION |
|
FILTERS |
|
|
|
|
|
|
|
2 BASIN |
|
|
|
|
|
|
|
|||
|
|
|
|
|
|
|
|||||
water CONTACT SOLIDS BASIN |
|
|
|
|
|
|
|
5 |
|||
|
|
|
Carbon dioxide |
|
Chlorine |
CLEARWELL |
Treated |
||||
|
|
|
|
|
Fluoride |
||||||
|
|
|
|
|
|
(finished) |
|||||
|
|
|
|
|
|
|
|
|
|
|
water |
|
|
|
|
|
|
|
|
|
|
|
|
WQR 2 |
CITY OF BLOOMINGTON WATER QUALITY REPORT, JUNE 2021 |
FREQUENTLY ASKED QUESTIONS ABOUT BLOOMINGTON’S WATER
WHY IS THE WATER FROM MY FAUCET CLOUDY?
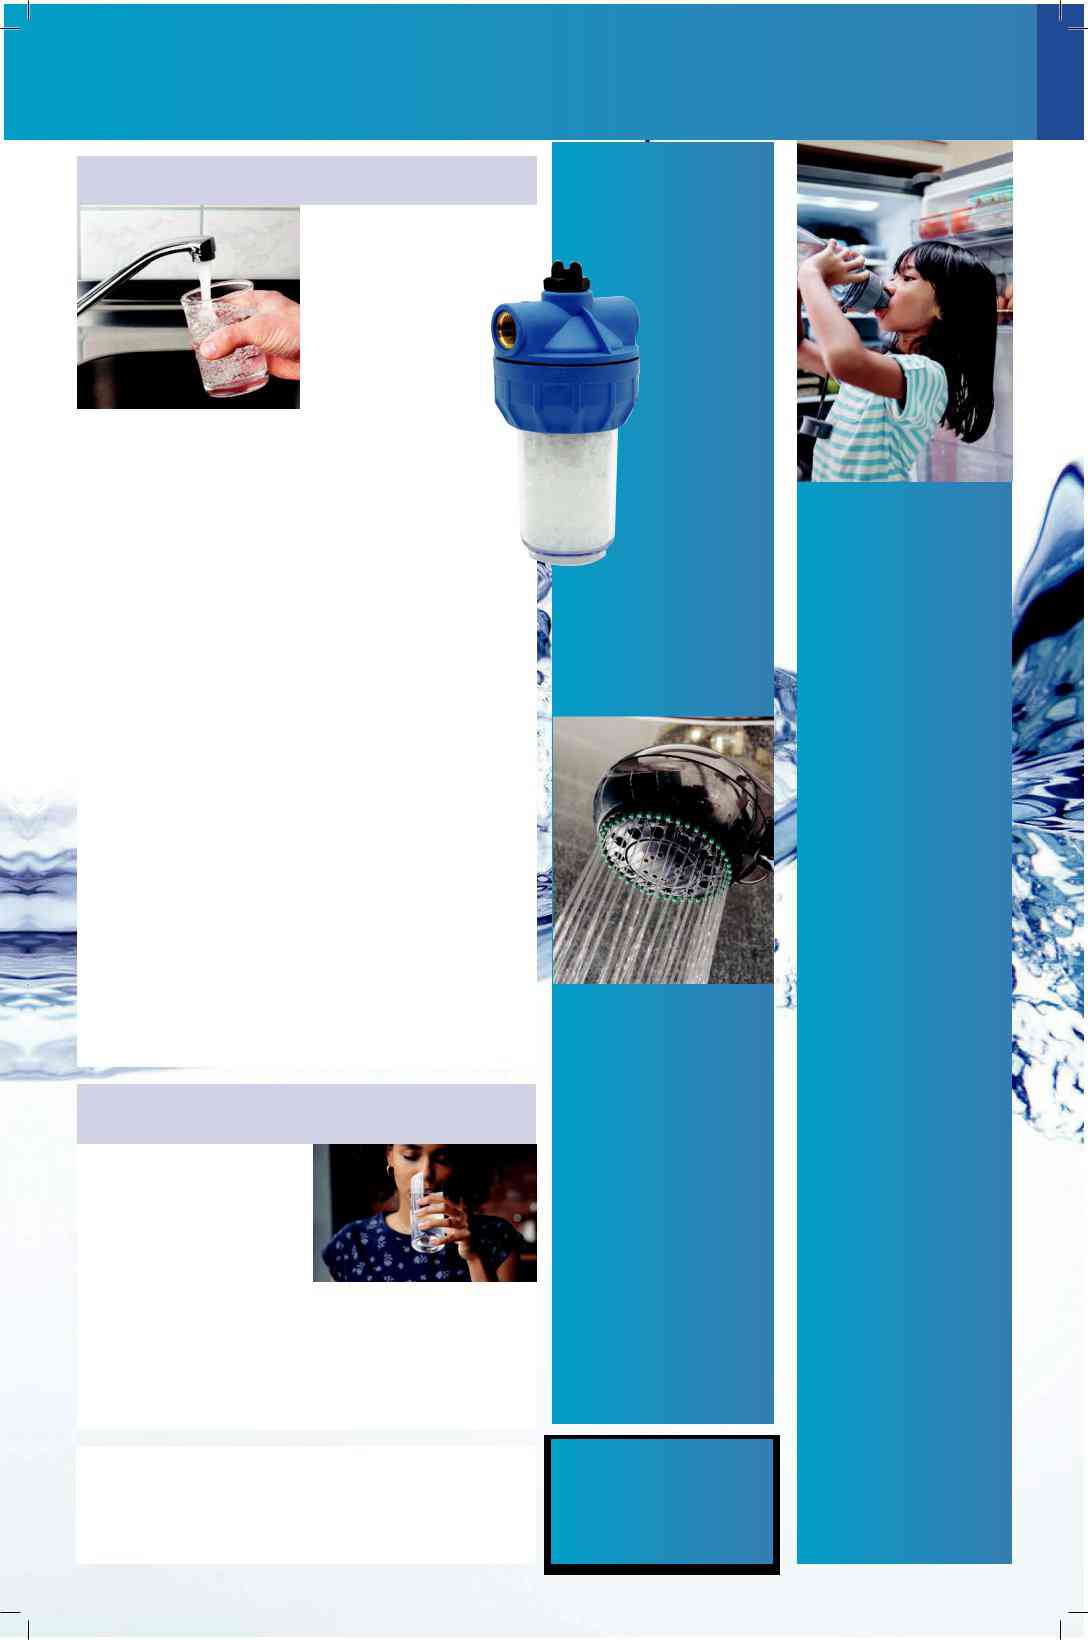
SHOULD I GET A
WATER FILTRATION SYSTEM?
Occasionally, the City receives calls about water that appears cloudy or milky.
Usually indicating the presence of either oxygen or calcium, cloudy water is perfectly safe to drink.
Oxygen in water: Sometimes water fresh from the tap appears cloudy. Within a minute or two, the cloudiness rises toward the top of a glass and before long the whole glass is crystal clear. This is caused by excess oxygen escaping from the water.
Changes in temperature and pressure can cause the oxygen dissolved in water to reach a supersaturated state where more oxygen is in the water than it can hold. When the water passes through a faucet, the disturbance is enough to release the excess oxygen from the water, forming microscopic bubbles. The bubbles are so tiny that it takes them a long time to rise through the water. No harm will come from using oxygenated water, and you don’t need to take any corrective action if you experience it.
Calcium in water: The chemistry of water is surprisingly complex, and many factors influence how it behaves. The City treats Bloomington’s water so that it is slightly prone to deposit a trace of calcium sediment as it travels
through its distribution system. This reduces the likelihood that it might corrode water mains or leach lead or copper from customers’ plumbing and fixtures. Usually, this calcium sediment remains
at the bottom of the water mains, unnoticed by water users.
However, the calcium can be stirred up when a large volume of water is drawn through a water main in a short time. Events that can increase water velocity include firefighting, water main breaks, hydrant maintenance and the filling of water or
When calcium causes cloudiness, it is usually noticed in cold water. Let a glassful of the cloudy water sit for about 30 minutes and any calcium, appearing as a white or grayish substance, will settle to the bottom of the glass. Though it may be visually unappealing, such water is perfectly safe to drink or use for cooking.
To clean calcium sediment from your system, we recommend that you wait an hour or two to allow the calcium in the main to settle. Then, open a large faucet such as a bathtub faucet and let the cold water run for about 20 minutes. This will draw clean water through your system and should remove any remaining calcium from your pipes.
If you have any concerns or if your water remains cloudy after taking these steps, call
Because Bloomington’s water surpasses all federal
and state standards, home filtration systems are not necessary.
However, if you choose to purchase a filtration system for aesthetic or medical reasons, keep the following
in mind:
- Find out if the filter you are considering is capable of removing substances that concern you.
- Look for filters that have been certified
by NSF International (an independent testing group) and Underwriters Laboratory (UL).
- Follow the manufacturer’s maintenance instructions carefully for usage and filter replacement frequency guidelines.
WATER SOFTENING
The City’s
LEAD IN WATER
Lead in drinking water primarily comes from components
associated with home plumbing. The City is responsible for providing
Minimizing exposure to lead
Lead pipes, solder, brass faucets and other plumbing in your home pose the greatest threat of adding dangerous levels of lead to your water. A few simple practices can minimize your exposure to lead from your home.
First, always use cold water for your cooking and drinking. If your plumbing contains lead, hot water will draw more lead out of it. Second, allow your cold water to run for 30 seconds to two minutes before using. This flushes out any water that may have been in your pipes long enough to pick up higher concentrations of lead.
The presence of lead ranks among the most common health concerns people have about drinking water. Studies suggest
FOR PEOPLE WITH COMPROMISED IMMUNE SYSTEMS
in Bloomington’s water, reducing it from 19 grains per gallon to about
5.2 grains per gallon finished water. |
levels of lead once thought to be safe can pose risks, especially to unborn babies and children.
Infants and children who
Some people may be more vulnerable to contaminants in
drinking water than the general population.
These people should seek advice from their health care providers about drinking water. Guidelines from the
Environmental Protection Agency and Centers for Disease Control on appropriate means to lessen the risk of infection by Cryptosporidium and other microbial contaminants are available from the Safe Drinking Water Hotline:
The water is also treated to be |
noncorrosive. This helps prevent |
unsafe levels of lead and copper |
from leaching into the water from |
home plumbing. Home softening |
systems can further reduce water |
hardness, usually by adding a small |
amount of sodium. |
Bloomington is one of 24 |
Minnesota municipal utilities |
that softens water, which means |
homeowners do not need to |
purchase their own |
systems. |
drink water containing excessive levels of lead could experience delays in their physical or mental development. Children can show slight deficits in attention span and learning abilities. Adults who drink this water over many years can develop kidney problems or high blood pressure.
Fortunately, over years of regular and rigorous monitoring, Bloomington’s water has never been found to be a significant source of lead.
For more information, call the Safe Drinking Water Hotline at
In Bloomington, water consumption averages about 65 gallons per person daily. Only one percent of water provided by water suppliers is used for drinking and cooking. Water is more frequently used for other purposes, including washing machines, toilets, showers, baths, faucets and leaks.
WWW.EPA.GOV
THE ESTIMATED COST OF HOME WATER SOFTENING RANGES BETWEEN $4.01
AND $4.84 PER 1,000 GALLONS OF WATER, COMPARED TO $3.69 PER 1000 GALLONS FOR
CITY OF BLOOMINGTON WATER QUALITY REPORT, JUNE 2021 |
WQR 3 |
WATER PURITY
INFORMATION
PROVIDED BY THE UNITED STATES ENVIRONMENTAL PROTECTION AGENCY
Drinking water sources in the
United States for both tap water and bottled water include rivers, lakes, streams, ponds, reservoirs, springs and wells. As water travels over or through
the ground, it dissolves naturally occurring minerals and, sometimes, radioactive material. Water also picks up substances resulting from animal or human activity.
To ensure that tap water is safe to drink, the Environmental Protection Agency regulates the amount of certain contaminants in water provided by public systems.
BLOOMINGTON’S WATER IS REGULARLY TESTED
2020 WATER QUALITY RESULTS
|
he Minnesota Department of Health and City staff |
results performed on Bloomington water. The lower half |
||||||
|
regularly test samples of Bloomington’s water for |
presents results for Minneapolis water which is blended into |
||||||
|
contaminants. Substances detected appear in the table |
Bloomington’s distribution system. |
|
|
||||
below. Undetected substances are not listed and unregulated |
Information on Bloomington’s Source Water Assessment |
|||||||
T |
|
|
|
|
can be found at blm.mn/swa or by calling the MDH at |
|||
contaminants are only listed if federal health risk limits |
||||||||
are exceeded. The top half of the table summarizes test |
|
|
||||||
|
|
|
|
|
|
|
||
Detected |
Amount detected |
Maximum |
Target |
Typical source of substance |
Type |
Meets |
||
substance |
(MCL) |
(MCLG) |
standards? |
|||||
CITY OF BLOOMINGTON |
|
|
|
|
|
|||
Chlorine (ppm) |
Avg. = 2.29 |
4 MRDL |
4 MRDLG |
Water additive used to control microbes |
R |
Yes |
||
(1.90 – 2.7) |
||||||||
|
|
|
|
|
|
|
||
Copper (ppm) |
90% = 0.02 (0 of 30 |
AL = 1.3 |
1.3 |
Corrosion of household plumbing systems; erosion of |
R |
Yes |
||
(7/2020) |
sites over AL) |
natural deposits |
||||||
|
|
|
|
|||||
|
|
Avg. = 0.75 |
|
|
State of Minnesota requires all municipal water |
|
|
|
Fluoride (ppm) |
4 |
4 |
systems to add fluoride to the drinking water to |
R |
Yes |
|||
(0.71 – 0.85) |
promote strong teeth; erosion of natural deposits; |
|||||||
|
|
|
|
|
|
|||
|
|
|
|
|
discharge from fertilizer and aluminum factories |
|
|
|
Haloacetic acids |
Avg. = 16.5 |
60 |
0 |
Byproduct of drinking water disinfection |
R |
Yes |
||
(HAA5) (ppb) |
(3.6 – 29.3) |
|||||||
|
|
|
|
|
||||
Lead (ppb) |
90% = 2.2 (0 of 30 |
|
|
Corrosion of household plumbing systems; erosion of |
|
|
||
AL = 15 |
0 |
natural deposits |
R |
Yes |
||||
(7/2020) |
sites over AL) |
|||||||
|
|
See page WQR 3 |
|
|
||||
|
|
|
|
|
|
|
||
Sodium (ppm) |
6.33 |
U |
U |
Erosion of natural deposits |
U |
NA |
||
Sulfate (ppm) |
18.2 |
U |
U |
Erosion of natural deposits |
U |
NA |
||
Trihalomethanes |
Avg. = 10.9 |
80 |
0 |
Byproduct of drinking water disinfection |
R |
Yes |
||
(TTHM) (ppb) |
(3.6 – 16.6) |
|||||||
|
|
|
|
|
||||
CITY OF MINNEAPOLIS
The Food and Drug Administration regulates contaminants in bottled water to provide the same public health protection.
Drinking water, including bottled water, may be expected to contain reasonably small amounts of some contaminants. Their presence does not necessarily indicate that the water poses a health risk. Information about contaminants and potential health effects can be obtained by calling the EPA’s Safe Drinking Water Hotline at
Chloramine (ppm)
Copper (ppm) (10/15/18)
Fluoride (ppm)
Haloacetic acids (HAA5) (ppb)
Lead (ppb) (10/15/18)
Trihalomethanes (TTHM) (ppb)
Turbidity (NTU)
Avg. = 3.41
(3.2
90% = 0.06 (0 of 50
sites over AL)
Avg. = 0.67
(0.62 – 0.68)
Avg. = 30.7 (1.2 – 30.9)
90% = 3.8 (2 of 50
sites over AL)
Avg. 30
(6.0 – 33.8)
0.16 NTU
- MRDL AL = 1.3
4
60
AL = 15
80
NTU
- MRDLG 1.3
4
0
0
0
NA
Water additive used to control microbes
Corrosion of household plumbing systems; erosion of
natural deposits
State of Minnesota requires all municipal water systems to add fluoride to the drinking water to promote strong teeth; erosion of natural deposits; discharge from fertilizer and aluminum factories
Byproduct of drinking water disinfection
Corrosion of household plumbing systems; erosion of
natural deposits
Byproduct of drinking water disinfection
Soil runoff
R
R
R
R
R
R
R
Yes
Yes
Yes
Yes
Yes
Yes
Yes
CONTAMINANTS THAT MAY BE PRESENT IN UNTREATED SOURCE WATER
Microbial contaminants, such as viruses and bacteria, may
|
|
|
|
|
|
|
Range of |
Average |
|
||
|
percent |
of percent |
|
||
Detected substance |
Typical source of substance |
ods (quarters) out |
|||
removal |
removal |
||||
|
|
of compliance |
|||
|
achieved |
achieved |
|
||
CITY OF MINNEAPOLIS |
Avg. = 61% |
|
|
|
|
Total organic carbon |
62% |
Naturally present in the environment |
0 |
||
52 – 69% |
|||||
|
|
|
|
come from sewage treatment plants, septic systems, agricultural livestock operations and wildlife.
Inorganic contaminants, such as salts and metals, can occur naturally or result from urban storm runoff, industrial or domestic wastewater discharges, oil and gas production, mining and farming.
Pesticides and herbicides
come from a variety of sources such as agriculture, urban stormwater runoff and residential uses.
Contaminant Comparison value
CITY OF BLOOMINGTON
Manganese |
100 ppb |
Group of 6 |
NA |
Haloacetic Acids |
|
(HAA6Br) |
|
Group of 9 |
NA |
Haloacetic Acids |
|
(HAA9) |
|
Potential health effects and corrective actions
.
Total Haloacetic Acids (HAAs), Total Trihalomethanes (TTHMs): We are required to monitor our drinking water for specific contaminants on a regular basis. Results of regular monitoring are an indicator of whether or not drinking water meets health standards. During October 2020 to December 2020, the Utilities Division did not complete all monitoring or testing for HAAs and TTHMs and therefore cannot confirm these water quality parameters for that time period. However, testing results prior to and after that time including additional sampling on April 15, 2021, do confirm water quality meets all state and federal standards as usual.
Range of detected test results
- – 0.98 ppb
0.00 – 1.24 ppb
- – 28.19 ppb
Organic chemical contaminants, including synthetic and volatile organic chemicals, are byproducts of industrial processes and petroleum production, and can also come from gas stations, urban stormwater runoff and septic systems.
Radioactive contaminants can occur naturally or be the result of oil and gas production and mining activies.
WQR 4
KEY
AL Action level. An amount that, if exceeded, triggers a specific response that a water system must follow.
cfu Colony forming unit.
MCL Maximum contaminant level. The highest level allowed in drinking water. MCLs are set as close to MCLG as feasible using the best available treatment technology.
MCLG Maximum contaminant level goal. Below this level there is no known or expected health risk. MCLGs allow for a margin of safety.
MRDL Maximum residual disinfectant level.
MRDLG Maximum residual disinfectant level goal.
NA Not applicable.
nd No detection.
NTU Nephelometric turbidity unit. A measure of water clarity.
ppb Parts per billion. Units of a substance, in pure form, found in every billion units of water.
ppm Parts per million. Units of a substance, in pure form, found in every million units of water.
- Regulated.
- Treatment technique. A required process intended to re- duce the level of a contaminant.
- Unregulated, but monitoring is required by the State of Minnesota. No limits have been set for this compound.
90% Value obtained after disregarding the 10 percent of the sam- ples taken that had the highest levels.
CITY OF BLOOMINGTON WATER QUALITY REPORT, JUNE 2021
Contaminants
Fall River Water Department
EWG's drinking water quality report shows results of tests conducted by the water utility and provided to the Environmental Working Group by the Massachusetts Department of Environmental Protection, as well as information from the U.S. EPA Enforcement and Compliance History database (ECHO). For the latest quarter assessed by the U.S. EPA (January 2019 - March 2019), tap water provided by this water utility was in compliance with federal health-based drinking water standards.
Utility details
- Serves: 88857
- Data available: 2012-2017
- Data Source: Surface water
- Total: 19
Contaminants That Exceed Guidelines
- Bromodichloromethane
- Chloroform
- Dibromochloromethane
- Dichloroacetic acid
- Total trihalomethanes (TTHMs)
- Trichloroacetic acid
Other Detected Contaminants
- Aluminum
- Barium
- Chlorate
- Dibromoacetic acid
- Fluoride
- Haloacetic acids (HAA5)
- Manganese
- Monobromoacetic acid
- Monochloroacetic acid
- Nitrate
- Perchlorate
- Strontium
- Vanadium
Reminder
Always take extra precautions, the water may be safe to drink when it leaves the sewage treatment plant but it may pick up pollutants during its way to your tap. We advise that you ask locals or hotel staff about the water quality. Also, note that different cities have different water mineral contents.