Table of Contents
Can You Drink Tap Water in Cocoa?
Yes, Cocoa's tap water is generally considered safe to drink as Cocoa has no active health based violations of the Safe Drinking Water Act (SDWA) that we are aware of. Other factors such as lead piping in a home, or low levels of pollutants on immunocompromised individuals, should also be considered, however. To find more recent info we might have, you can check out our boil water notice page or the city's water provider website.
According the EPA’s ECHO database, from April 30, 2019 to June 30, 2022, Cocoa's water utility, City of Cocoa, had 2 non-health-based violations of the Safe Drinking Water Act. For more details on the violations, please see our violation history section below. The last violation for Cocoa was resolved on Sept. 30, 2021. This assessment is based on the City of Cocoa water system, other water systems in the city may have different results.
While tap water that meets the EPA health guidelines generally won’t make you sick to your stomach, it can still contain regulated and unregulated contaminants present in trace amounts that could potentially cause health issues over the long-run. These trace contaminants may also impact immunocompromised and vulnerable individuals.
The EPA is reviewing if it’s current regulations around pollutant levels in tap water are strict enough, and the health dangers posed by unregulated pollutants, like PFAS.
Water Quality Report for Cocoa Tap Water
The most recent publicly available numbers for measured contaminant levels in Cocoa tap water are in its 2020 Water Quality Report. As you can see, there are levels which the EPA considers to be acceptable, but being below the maximum allowable level doesn’t necessarily mean the water is healthy.
Lead in tap water, for example, is currently allowed at up to 15ppb by the EPA, but it has set the ideal goal for lead at zero. This highlights how meeting EPA standards doesn’t necessarily mean local tap water is healthy.
EPA regulations continue to change as it evaluates the long term impacts of chemicals and updates drinking water acceptable levels. The rules around arsenic, as well as, lead and copper are currently being re-evaluated.
There are also a number of "emerging" contaminants that are not currently. For example, PFAS (Per- and polyfluoroalkyl substances), for which the EPA has issued a health advisory. PFAS are called "forever chemicals" since they tend not to break down in the environment or the human body and can accumulate over time.
We recommend looking at the contaminants present in Cocoa's water quality reports, or getting your home's tap water tested to see if you should be filtering your water.
Cocoa Tap Water Safe Drinking Water Act Violation History - Prior 10 Years
Below is a ten year history of violations for the water system named City of Cocoa for Cocoa in Florida. For more details please see the "What do these Violations Mean?" section below.
From July 1, 2021 to Sept. 30, 2021, Cocoa had 2 non-health based Safe Drinking Water Act violations with the violation category being Monitoring and Reporting, more specifically, the violation code was Monitoring and Reporting (DBP) which falls into the Disinfectants and Disinfection Byproducts Rule rule code group, and the Stage 2 Disinfectants and Disinfection Byproducts Rule rule code family for the following contaminant codes: Total Haloacetic Acids (HAA5), TTHM.
From Jan. 1, 2019 to Jan. 31, 2019, Cocoa had 1 non-health based Safe Drinking Water Act violation with the violation category being Monitoring Violation, more specifically, the violation code was Monitoring, Routine (RTCR) which falls into the Microbials rule code group, and the Total Coliform Rules rule code family for the following contaminant code: Revised Total Coliform Rule.
From Oct. 1, 2018 to Dec. 31, 2018, Cocoa had 2 non-health based Safe Drinking Water Act violations with the violation category being Monitoring and Reporting, more specifically, the violation code was Monitoring and Reporting (DBP) which falls into the Disinfectants and Disinfection Byproducts Rule rule code group, and the Stage 2 Disinfectants and Disinfection Byproducts Rule rule code family for the following contaminant codes: Total Haloacetic Acids (HAA5), TTHM.
From April 1, 2018 to June 30, 2018, Cocoa had 2 non-health based Safe Drinking Water Act violations with the violation category being Monitoring and Reporting, more specifically, the violation code was Monitoring and Reporting (DBP) which falls into the Disinfectants and Disinfection Byproducts Rule rule code group, and the Stage 2 Disinfectants and Disinfection Byproducts Rule rule code family for the following contaminant codes: TTHM, Total Haloacetic Acids (HAA5).
From Jan. 1, 2018 to March 31, 2018, Cocoa had 4 non-health based Safe Drinking Water Act violations with the violation category being Monitoring and Reporting, more specifically, the violation code was Monitoring and Reporting (DBP) which falls into the Disinfectants and Disinfection Byproducts Rule rule code group, and the Stage 2 Disinfectants and Disinfection Byproducts Rule rule code family for the following contaminant codes: Total Haloacetic Acids (HAA5), Total Haloacetic Acids (HAA5), TTHM, TTHM.
From Jan. 1, 2017 to Dec. 31, 2017, Cocoa had 1 non-health based Safe Drinking Water Act violation with the violation category being Monitoring and Reporting, more specifically, the violation code was Monitoring, Regular which falls into the Chemicals rule code group, and the Inorganic Chemicals rule code family for the following contaminant code: Nitrate.
From Jan. 1, 2016 to March 31, 2016, Cocoa had 1 health-based Safe Drinking Water Act violation with the violation category being Maximum Contaminant Level Violation, more specifically, the violation code was Maximum Contaminant Level Violation, Average which falls into the Disinfectants and Disinfection Byproducts Rule rule code group, and the Stage 2 Disinfectants and Disinfection Byproducts Rule rule code family for the following contaminant code: TTHM.
Is there Lead in Cocoa Water?
Based on the EPA’s ECHO Database, 90% of the samples taken from the Cocoa water system, City of Cocoa, between sample start date and sample end date, were at or below, 0.0031 mg/L of lead in Cocoa water. This is 20.7% of the 0.015 mg/L action level. This means 10% of the samples taken from Cocoa contained more lead.
While Cocoa water testing may have found 0.0031 mg/L of lead in its water, that does not mean your water source has the same amount. The amount of lead in water in a city can vary greatly from neighborhood to neighborhood, or even building to building. Many buildings, particularly older ones, have lead pipes or service lines which can be a source of contamination. To find out if your home has lead, we recommend getting you water tested.
No amount of lead in water is healthy, only less dangerous. As lead accumulates in our bodies over time, even exposure to relatively small amounts can have negative health effects. For more information, please check out our Lead FAQ page.
Are there PFAS in Cocoa Tap Water?
Currently, testing tap water for PFAS isn’t mandated on a national level. We do have a list of military bases where there have been suspected or confirmed leaks. There appears to be at least one military base - Cape Canaveral - near Cocoa with suspected leaks.
With many potential sources of PFAS in tap water across the US, the best information we currently have about which cities have PFAS in their water is this ewg map, which you can check to see if Cocoa has been evaluated for yet.
Our stance is better safe than sorry, and that it makes sense to try to purify the tap water just in case.
Cocoa SDWA Violation History Table - Prior 10 Years
| Compliance Period | Status | Health-Based? | Category Code | Code | Rule Code | Contaminant Code | Rule Group Code | Rule Family Code |
|---|---|---|---|---|---|---|---|---|
| 07/01/2021 - 09/30/2021 | Resolved | No | Monitoring and Reporting (MR) | Monitoring and Reporting (DBP) (27) | Stage 2 Disinfectants and Disinfection Byproducts Rule (220) | Total Haloacetic Acids (HAA5) (2456) | Disinfectants and Disinfection Byproducts Rule (200) | Stage 2 Disinfectants and Disinfection Byproducts Rule (220) |
| 07/01/2021 - 09/30/2021 | Resolved | No | Monitoring and Reporting (MR) | Monitoring and Reporting (DBP) (27) | Stage 2 Disinfectants and Disinfection Byproducts Rule (220) | TTHM (2950) | Disinfectants and Disinfection Byproducts Rule (200) | Stage 2 Disinfectants and Disinfection Byproducts Rule (220) |
| 01/01/2019 - 01/31/2019 | Resolved | No | Monitoring Violation (MON) | Monitoring, Routine (RTCR) (3A) | Revised Total Coliform Rule (111) | Revised Total Coliform Rule (8000) | Microbials (100) | Total Coliform Rules (110) |
| 10/01/2018 - 12/31/2018 | Resolved | No | Monitoring and Reporting (MR) | Monitoring and Reporting (DBP) (27) | Stage 2 Disinfectants and Disinfection Byproducts Rule (220) | Total Haloacetic Acids (HAA5) (2456) | Disinfectants and Disinfection Byproducts Rule (200) | Stage 2 Disinfectants and Disinfection Byproducts Rule (220) |
| 10/01/2018 - 12/31/2018 | Resolved | No | Monitoring and Reporting (MR) | Monitoring and Reporting (DBP) (27) | Stage 2 Disinfectants and Disinfection Byproducts Rule (220) | TTHM (2950) | Disinfectants and Disinfection Byproducts Rule (200) | Stage 2 Disinfectants and Disinfection Byproducts Rule (220) |
| 04/01/2018 - 06/30/2018 | Resolved | No | Monitoring and Reporting (MR) | Monitoring and Reporting (DBP) (27) | Stage 2 Disinfectants and Disinfection Byproducts Rule (220) | TTHM (2950) | Disinfectants and Disinfection Byproducts Rule (200) | Stage 2 Disinfectants and Disinfection Byproducts Rule (220) |
| 04/01/2018 - 06/30/2018 | Resolved | No | Monitoring and Reporting (MR) | Monitoring and Reporting (DBP) (27) | Stage 2 Disinfectants and Disinfection Byproducts Rule (220) | Total Haloacetic Acids (HAA5) (2456) | Disinfectants and Disinfection Byproducts Rule (200) | Stage 2 Disinfectants and Disinfection Byproducts Rule (220) |
| 01/01/2018 - 03/31/2018 | Archived | No | Monitoring and Reporting (MR) | Monitoring and Reporting (DBP) (27) | Stage 2 Disinfectants and Disinfection Byproducts Rule (220) | Total Haloacetic Acids (HAA5) (2456) | Disinfectants and Disinfection Byproducts Rule (200) | Stage 2 Disinfectants and Disinfection Byproducts Rule (220) |
| 01/01/2018 - 03/31/2018 | Resolved | No | Monitoring and Reporting (MR) | Monitoring and Reporting (DBP) (27) | Stage 2 Disinfectants and Disinfection Byproducts Rule (220) | Total Haloacetic Acids (HAA5) (2456) | Disinfectants and Disinfection Byproducts Rule (200) | Stage 2 Disinfectants and Disinfection Byproducts Rule (220) |
| 01/01/2018 - 03/31/2018 | Resolved | No | Monitoring and Reporting (MR) | Monitoring and Reporting (DBP) (27) | Stage 2 Disinfectants and Disinfection Byproducts Rule (220) | TTHM (2950) | Disinfectants and Disinfection Byproducts Rule (200) | Stage 2 Disinfectants and Disinfection Byproducts Rule (220) |
| 01/01/2018 - 03/31/2018 | Archived | No | Monitoring and Reporting (MR) | Monitoring and Reporting (DBP) (27) | Stage 2 Disinfectants and Disinfection Byproducts Rule (220) | TTHM (2950) | Disinfectants and Disinfection Byproducts Rule (200) | Stage 2 Disinfectants and Disinfection Byproducts Rule (220) |
| 01/01/2017 - 12/31/2017 | Resolved | No | Monitoring and Reporting (MR) | Monitoring, Regular (03) | Nitrates (331) | Nitrate (1040) | Chemicals (300) | Inorganic Chemicals (330) |
| 01/01/2016 - 03/31/2016 | Resolved | Yes | Maximum Contaminant Level Violation (MCL) | Maximum Contaminant Level Violation, Average (02) | Stage 2 Disinfectants and Disinfection Byproducts Rule (220) | TTHM (2950) | Disinfectants and Disinfection Byproducts Rule (200) | Stage 2 Disinfectants and Disinfection Byproducts Rule (220) |
What do these Violations Mean?
Safe Drinking Water Act Violations categories split into two groups, health based, and non-health based. Generally, health based violations are more serious, though non-health based violations can also be cause for concern.
Health Based Violations
- Maximum contaminant levels (MCLs) - maximum allowed contaminant level was exceeded.
- Maximum residual disinfectant levels (MRDLs) - maximum allowed disinfectant level was exceeded.
- Other violations (Other) - the exact required process to reduce the amounts of contaminants in drinking water was not followed.
Non-Health Based Violations
- Monitoring and reporting violations (MR, MON) - failure to conduct the required regular monitoring of drinking water quality, and/or to submit monitoring results on time.
- Public notice violations (Other) - failure to immediately alert consumers if there is a serious problem with their drinking water that may pose a risk to public health.
- Other violations (Other) - miscellaneous violations, such as failure to issue annual consumer confidence reports or maintain required records.
SDWA Table Key
| Field | Description |
|---|---|
| Compliance Period | Dates of the compliance period. |
| Status |
Current status of the violation.
|
| Health-Based? | Whether the violation is health based. |
| Category Code |
The category of violation that is reported.
|
| Code | A full description of violation codes can be accessed in the SDWA_REF_CODE_VALUES (CSV) table. |
| Contaminant Code | A code value that represents a contaminant for which a public water system has incurred a violation of a primary drinking water regulation. |
| Rule Code |
Code for a National Drinking Water rule.
|
| Rule Group Code |
Code that uniquely identifies a rule group.
|
| Rule Family Code |
Code for rule family.
|
For more clarification please visit the EPA's data dictionary.
Cocoa Water - Frequently Asked Questions
| By Phone: | 321-433-8700 |
| By Mail: | 351 SHEARER BLVD. COCOA, FL, 32922 |
Existing customers can login to their City of Cocoa account to pay their Cocoa water bill by clicking here.
If you want to pay your City of Cocoa bill online and haven't made an account yet, you can create an account online. Please click here to create your account to pay your Cocoa water bill.
If you don't want to make an account, or can't remember your account, you can make a one-time payment towards your Cocoa water bill without creating an account using a one time payment portal with your account number and credit or debit card. Click here to make a one time payment.
Moving to a new house or apartment in Cocoa means you will often need to put the water in your name with City of Cocoa. In order to put the water in your name, please click the link to the start service form below. Start service requests for water bills typically take two business days.
Leaving your house or apartment in Cocoa means you will likely need to take your name off of the water bill with City of Cocoa. In order to take your name off the water bill, please click the link to the stop service form below. Stop service for water bills requests typically take two business days.
USER SUBMITTED RATINGS
- Drinking Water Pollution and Inaccessibility
- Water Pollution
- Drinking Water Quality and Accessibility
- Water Quality
The above data is comprised of subjective, user submitted opinions about the water quality and pollution in Cocoa, measured on a scale from 0% (lowest) to 100% (highest).
Related FAQS
Cocoa Water Quality Report (Consumer Confidence Report)
The EPA mandates that towns and cities consistently monitor and test their tap water. They must report their findings in an annual Consumer Confidence Report. Below is the most recent water quality report from Cocoa's Water. If you would like to see the original version of the report, please click here.
CITY OF COCOA
ANNUAL
W A T E R
QUALITY
REPORT 2 0 1 8
PWSID#: FL 3050223
Claude H. Dyal
Water Treatment Plant
351 Shearer Blvd.
Cocoa, FL32922
A Message From the Director
This 2018 Water Quality Report contains detailed information about your drinking water, the steps we take to ensure its safety, the results of the sampling and testing we conducted between January 1, 2018 and December 31, 2018, and how we are working to conserve this resource for future generations.
At the Cocoa Utilities Department, our top priority is delivering clean, safe,
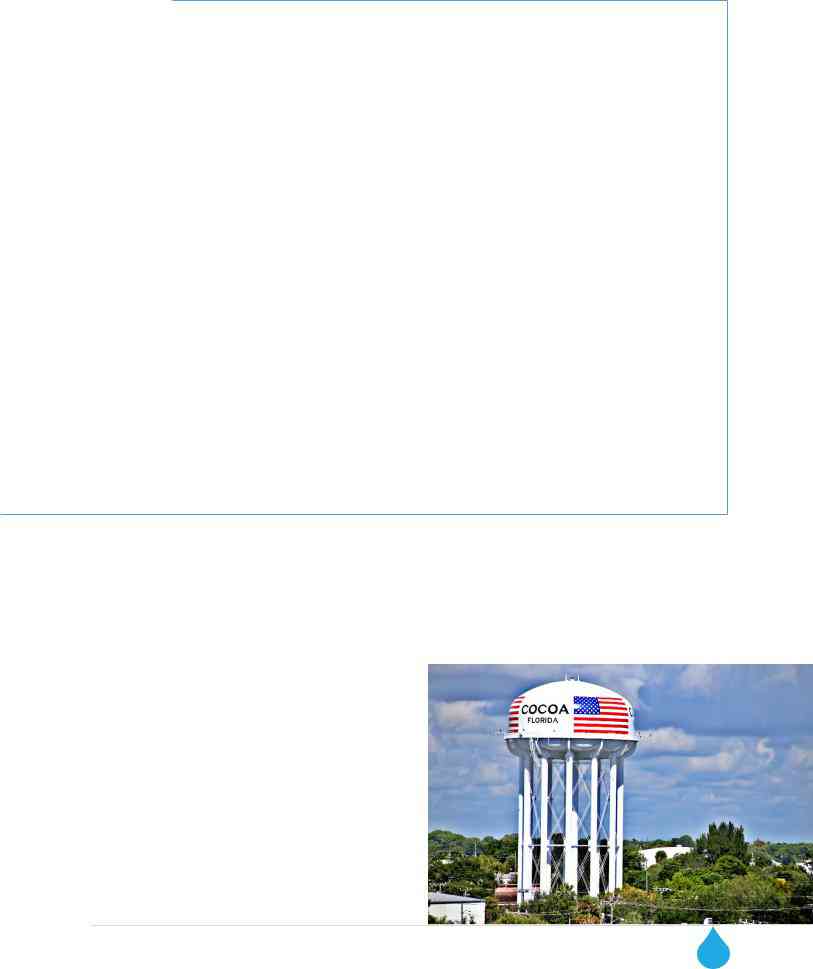
We supplement our groundwater supply with surface water drawn from the Taylor Creek Reservoir. The Taylor Creek Reservoir is located three miles from the Claude H. Dyal Water Treatment Plant. It was constructed in the 1960s as part of the original federal Central and Southern Florida Flood Control Project.
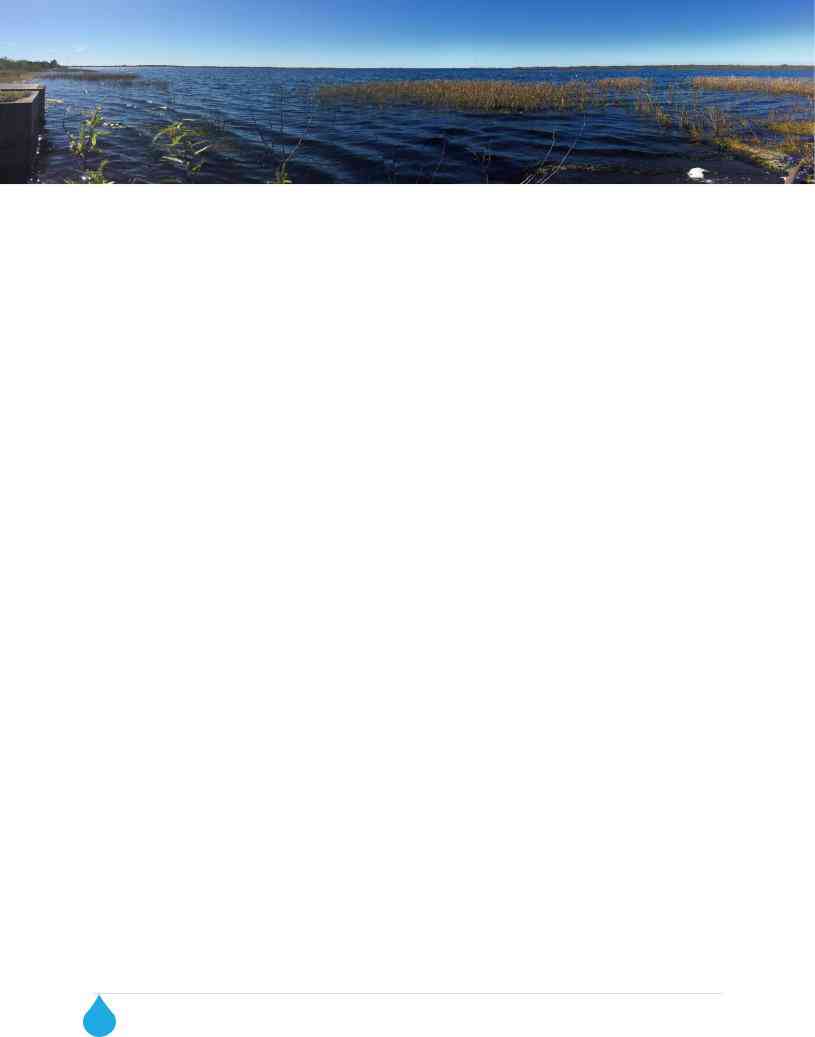
Our state certified water lab conducts thousands of chemical and bacteriological water quality tests each year. Our lab technicians test for more than 135 regulated and unregulated substances including lead and copper. A summary of that testing is included in this report.
The Cocoa Utilities Department is committed and serious about the work we do to provide safe,
John A. Walsh, P.E. Utilities Director
How to Obtain a Copy of This Report
This water quality report, also known as a Consumer Confidence Report, is produced annually in accordance with both federal and state requirements.
This report will be mailed to customers only upon request by calling (321)
please view www.cocoafl.org/waterqualityreport, call (321)
Cocoa Water
Whenever you enjoy a cool, refreshing drink of Cocoa’s
Cocoa provides water to approximately 84,000 customers in Cocoa, Rockledge, Port St. John, Merritt Island, Cape Canaveral, Cocoa Beach, Suntree/Viera, Patrick AFB, and the Kennedy Space Center. Serving a population of about 250,000.
The Cocoa Utilities Department is dedicated to providing our customers with premium drinking water and professional service. Our facilities are staffed with
As part of our commitment to excellence, we perform continuous testing and monitoring of your drinking water from our raw water supply, through the treatment process at our Dyal Water Treatment Plant (WTP), until it’s delivered to your home.
1 2 0 1 8 C i t y o f C o c o a W a t e r Q u a l i t y R e p o r t
The Cocoa Utilities Department values the trust you put in us every day and we are grateful for your support throughout the year.
Water Supply Sources
Groundwater Treatment
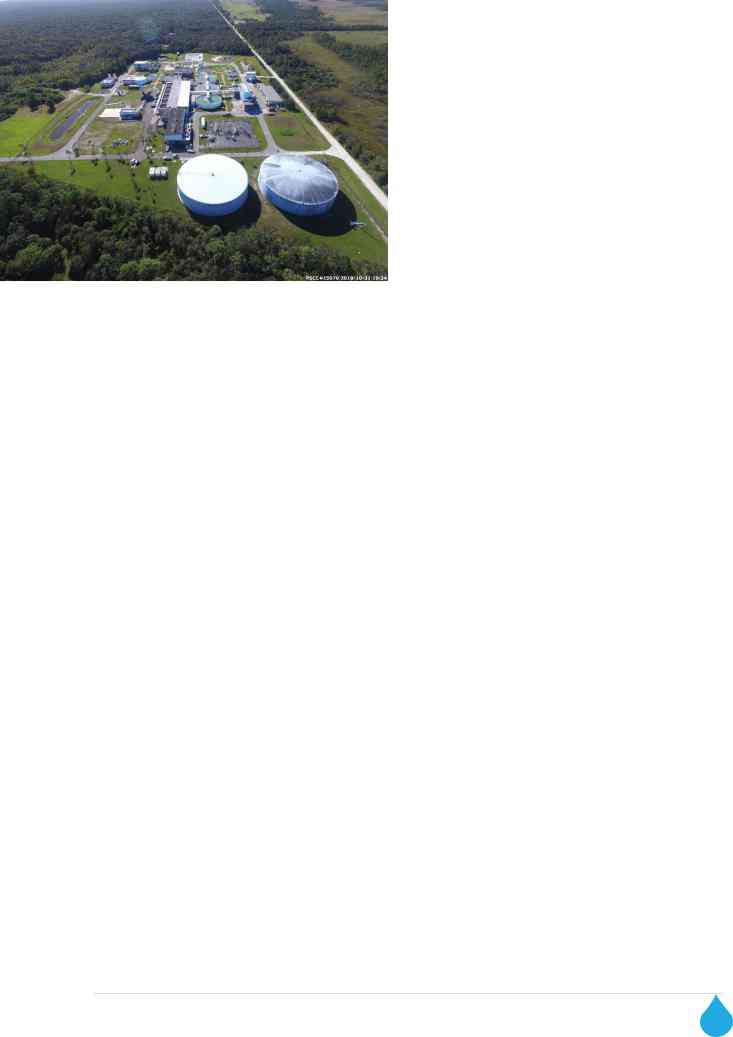
Cocoa’s primary water source is groundwater pumped from the Intermediate and Floridan Aquifers. Cocoa has supplied central Brevard County with high quality drinking water since 1957. Our drinking water system processed just over 7.38 billion gallons of water last year, with a peak flow of 24.76 million gallons per day (MGD) during the month of March. The Average daily flow was 20.23 MGD during 2018. Cocoa supplements its ground water supply with surface water from the Taylor Creek Reservoir and Aquifer Storage and Recovery (ASR) wells. In 2018, The Dyal WTP treated 6.49 billion gallons of groundwater and 0.89 billion gallons of surface water. The Dyal WTP injected 0.32 billion gallons into the ASR wells and recovered 0.07 billion gallons of water.
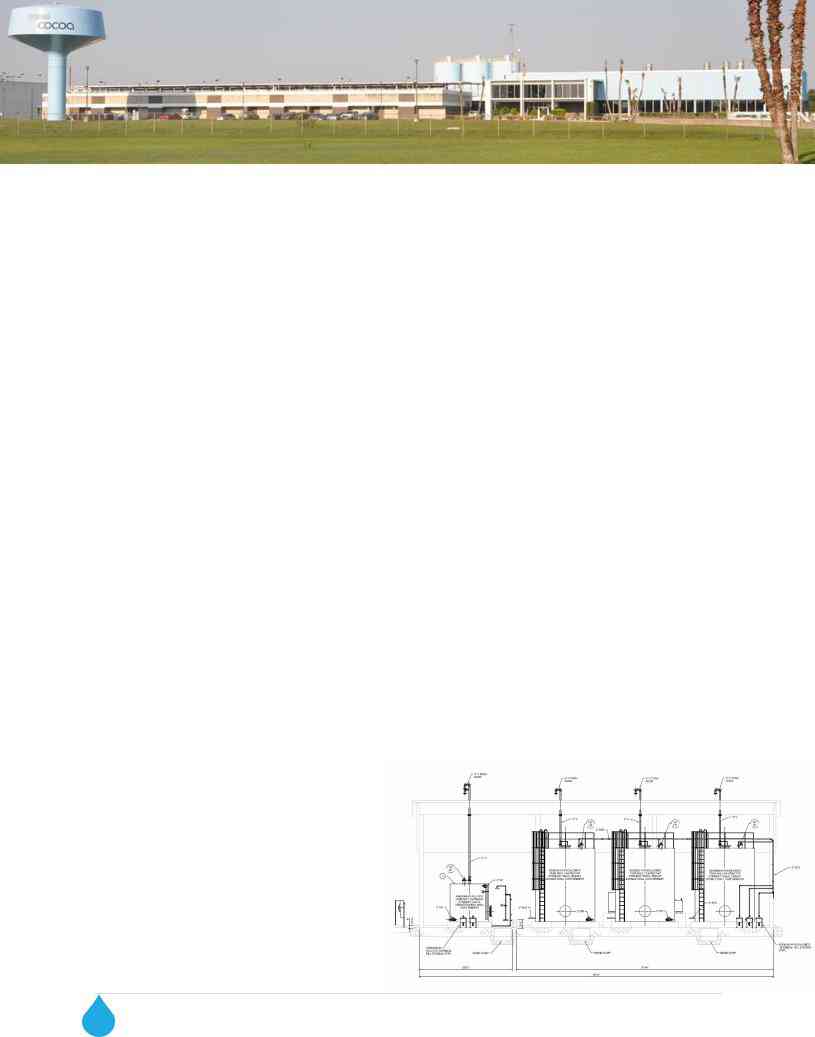
Groundwater treatment begins when raw water from our wellfields is pumped to our water treatment facility, the Claude H. Dyal Water Treatment Plant. The plant operates 24 hours a day, seven days a week to meet the needs of our water customers.
Ground water enters the plant where chlorine, lime, soda ash, and coagulant are added to remove hardness and suspended solids. Fluoride is then added to the water in accordance with the Environmental Protection Agency/Center For Disease Control guidelines. Carbon dioxide is
added to reduce the pH and to stabilize the water. Chloramination is used to disinfect the water after it passes through filters containing sand and anthracite coal and enters the clearwell. Turbidity (cloudiness) is constantly measured at each filter.
Surface Water Treatment
The Dyal WTP is unusual for Central Florida because it can treat both ground and surface water. Water from the Taylor Creek Reservoir is a supplemental source for Cocoa’s water supply.
Surface water requires a different type of treatment. After surface water enters the plant, ferric sulfate, hydrated lime, and a polymer are added. Ozone is injected into clarified water for disinfection, taste and odor removal. After adding ozone, the water is treated with hydrated lime, carbon dioxide, chlorine and ammonia before passing through sand and anthracite coal filters. Turbidity is constantly measured at each filter.
The surface water treatment plant was built alongside the existing ground water treatment plant and came
Aquifer Storage and Recovery (ASR) Wells
Cocoa has 10 ASR wells at the Dyal Water Treatment Plant for the storage of finished, treated water. This is a system of wells that stores finished water safely underground. During periods of high demand this high quality water can be pumped to the head of the plant or to the ground storage tanks.
Source Water Assessment
The Florida Department of Environmental Protection (FDEP) began conducting a statewide assessment of drinking water systems in 2004. The Source Water Assessment Program provides local leaders, water suppliers, and citizens with the information necessary to protect public drinking water sources from contamination.
Ground Water
In 2018 the Florida Department of Environmental Protection performed a Source Water Assessment
2 0 1 8 C i t y o f C o c o a W a t e r Q u a l i t y R e p o r t |
2 |
on our system. The assessment was conducted to provide information about any potential sources of contamination in the vicinity of our wells. FDEP identified 27 unique sources of contamination with a range of low to moderate risk. The assessment results are available on the FDEP Source Water Assessment and Protection Program website at https://fldep.dep.state.fl.us/swapp/ or they can be obtained by contacting the Conservation/Public Relations Officer at (321)
Surface Water
In 2018, the Florida Department of Environmental Protection performed a Source Water Assessment on our system. The assessment was conducted to provide information about any potential sources of contamination in the vicinity of our surface water intakes. The surface water system is considered to be at high risk because of the many potential sources of contamination present in the assessment area. The assessment results are available on the FDEP Source Water Assessment and Protection Program website at https://fldep.dep.state.fl.us/swapp/ or they can be obtained by contacting the Conservation/ Public Relations Officer at (321)
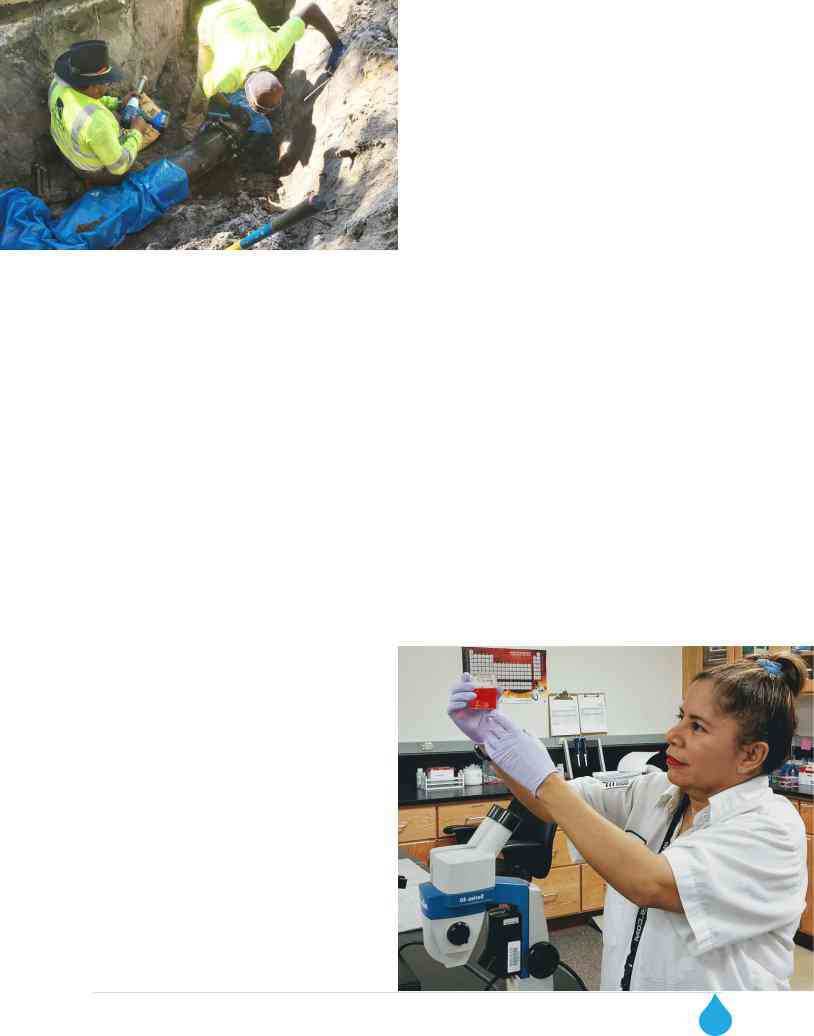
Cocoa Utilities Department Capital Improvement Program
No resource is more critical than water and the infrastructure that delivers it. We cannot exist without water systems that safely and reliably deliver water to our taps. Of all the infrastructure that we, as a community must maintain, none is more important than a reliable water network that receives regular investment and is continually improved.
The Cocoa Utilities Department’s Capital Improvement Program (CIP) was developed to
provide a perspective of the utility’s
The focus of the CIP is to preserve and improve the water system infrastructure while ensuring the efficient use of public funds. The following are some recent or ongoing CIP projects:
Pineda Water Main Crossing
Project Scope: Installation of 17,000 feet of 16- inch pipe across the Indian River, Merritt Island, and the Banana River near the Pineda Causeway to improve hydraulic, water quality and resiliency. Cocoa and Melbourne are working together to build two, parallel,
Budget Amount: $11,032,260
Schedule: Design Complete, October 2019
Dyal Chemical Conversion & Reliability Improvements (CCRIP)
Project Scope: Convert chlorine gas and anhydrous ammonia to sodium hypochlorite and ammonium sulfate, provide a redundant high service pumping facility, new generators & new maintenance/training building.
Budget Amount: $2,959,749
Schedule: Design Complete, November 2019
3 2 0 1 8 C i t y o f C o c o a W a t e r Q u a l i t y R e p o r t
Raw Water Pipeline Well 17 to 15
Project Scope: Design and installation of a new
Schedule: Design Complete, August 2019
Chase Hammock / N Tropical Trail Looping Improvements
Project Scope: This project, currently under construction, involves the installation of 3,200 feet of
Schedule: Completion, November 2019
SR 520 Water Main Replacement
Project Scope: This project will replace 2,400 feet of
Budget Amount: $1,674,273
Schedule: Construction Start, July 2019
Water Quality
Continuing Our Commitment
Cocoa’s Claude H. Dyal Water Treatment Plant routinely monitors for contaminants in your drinking water according to Federal and State Laws, rules, and regulations. This report is based on the results of our monitoring for the period of January 1, 2018 through December 31, 2018. Any data that was obtained before January 1, 2018 and presented in this report are from the most
recent testing performed in accordance with the laws, rules, and regulations.
Our NELAC (National Environmental Laboratory Accreditation Conference) certified laboratory analyzes water quality throughout the treatment process and distribution system to ensure safe drinking water is delivered to our customers. We remain vigilant in meeting the challenges of source water protection, water conservation, and community education while continuing to serve the needs of all of our water users.
Community Involvement is Encouraged
Interested customers are welcome to attend Cocoa’s regularly scheduled Council meetings held on the second and fourth Wednesday of every month. Please contact the City Clerk at (321) 433- 8488 to confirm day, time, and location of the meeting.
The Utilities Advisory Board meets quarterly (January/April/July/October). The Utilities Advisory Board advises the City Council on matters relating to utility subjects. Please contact the City Clerk at (321)
Questions?
For information about water quality or questions about this report, or to obtain paper copies of this report call (321)
2 0 1 8 C i t y o f C o c o a W a t e r Q u a l i t y R e p o r t |
4 |
Water Quality Testing Results
Definitions
In the following table you may find unfamiliar terms and abbreviations. To help you better understand these terms we've provided the following definitions:
Maximum Contaminant Level or MCL: The highest level of a contaminant that is allowed in drinking water. MCLs are set as close to the MCLGs as feasible using the best available treatment technology.
Maximum Contaminant Level Goal or MCLG:
The level of a contaminant in drinking water below which there is no known or expected risk to health. MCLGs allow for a margin of safety.
Action Level (AL): The concentration of a contaminant which, if exceeded, triggers treatment or other requirements that a water system must follow.
Initial Distribution System Evaluation (IDSE):
An important part of the Stage 2 Disinfection By- Products Rule (DBPR). The IDSE is a
Locational Running Annual Average (LRAA):
The average of sample analytical results for samples taken at a particular monitoring location during the previous four calendar quarters.
Maximum residual disinfectant level or MRDL: The highest level of a disinfectant allowed in drinking water. There is convincing evidence that addition of a disinfectant is necessary for
control of microbial contaminants.
Maximum residual disinfectant level goal or MRDLG: The level of a drinking water disinfectant below which there is no known or expected risk to health. MRDLGs do not reflect the benefits of the use of disinfectants to control microbial contaminants.
Million fibers per liter (MFL): Measure of the presence of asbestos fibers that are longer than 10 micrometers.
Millirem per year (mrem/yr): Measure of radiation absorbed by the body.
Nephelometric Turbidity Unit (NTU): Measure of the clarity of water. Turbidity in excess of 5 NTU is just noticeable to the average person.
“ND”: Means not detected and indicates that the substance was not found by laboratory analysis.
Parts per billion (ppb) or Micrograms per liter (µg/l): One part by weight of analyte to 1 billion parts by weight of the water sample.
Parts per million (ppm) or Milligrams per liter (mg/l): One part by weight of analyte to 1 million parts by weight of the water sample.
Parts per quadrillion (ppq) or Picograms per liter (picograms/l): One part by weight of analyte to 1 quadrillion parts by weight of the water sample.
Parts per trillion (ppt) or Nanograms per liter (nanograms/l): One part by weight of analyte to 1 trillion parts by weight of the water sample.
Picocurie per liter (pCi/L): Measure of the radioactivity in water.
Treatment Technique (TT): A required process intended to reduce the level of a contaminant in drinking water.
5 2 0 1 8 C i t y o f C o c o a W a t e r Q u a l i t y R e p o r t

2018 WATER QUALITY TEST RESULTS
MICROBIOLOGICAL CONTAMINANTS
|
Contaminant |
|
|
Dates of |
|
|
MCL |
|
|
|
|
|
Lowest Monthly |
|
|
|
|
|
|
|
|
|
|
|
|
|
|
|
|
|
Highest Single |
|
|
Percentage of |
|
|
|
|
|
|
|
|
Likely Source of |
|
|||
|
and Unit of |
|
|
sampling |
|
|
Violation |
|
|
|
|
|
|
MCLG |
|
|
MCL |
|
|
|
|||
|
|
|
|
|
|
|
Measurement |
|
|
Samples Meeting |
|
|
|
|
|
|
Contamination |
|
|||||
|
Measurement |
|
|
(mo./yr.) |
|
|
Y/N |
|
|
|
|
|
|
|
|
|
|
|
|
|
|||
|
|
|
|
|
|
|
|
|
|
Regulatory Limits |
|
|
|
|
|
|
|
|
|
|
|||
|
|
|
|
|
|
|
|
|
|
|
|
|
|
|
|
|
|
|
|
|
|
|
|
|
|
|
|
|
|
|
|
|
|
|
|
|
|
|
|
|
|
|
|
|
|
|
|
|
1 Turbidity |
2018 |
|
|
No |
0.64 |
|
100 |
|
|
N/A |
|
TT |
|
Soil Runoff |
||||||||
|
(NTU) |
|
(Daily) |
|
|
|
|
|
|
||||||||||||||
|
|
|
|
|
|
|
|
|
|
|
|
|
|
|
|
|
|
|
|
||||
2 RADIOACTIVE CONTAMINANTS
|
Contaminant and Unit of |
|
|
Dates of |
|
|
MCL |
|
|
5 |
Level |
|
|
Range |
|
|
|
|
|
|
|
|
Likely Source of |
|
|
|
|
sampling |
|
|
Violation |
|
|
|
|
of |
|
|
MCLG |
|
|
MCL |
|
|
|
||||
|
Measurement |
|
|
|
|
|
|
Detected |
|
|
|
|
|
|
|
|
Contamination |
|
||||||
|
|
|
(mo./yr.) |
|
|
Y/N |
|
|
|
|
Results |
|
|
|
|
|
|
|
|
|
||||
|
|
|
|
|
|
|
|
|
|
|
|
|
|
|
|
|
|
|
|
|
|
|||
|
Alpha emitters (pCi/L) |
2018 |
|
|
No |
|
|
4.4 |
|
|
0 |
|
15 |
|
|
Erosion of natural |
||||||||
|
|
(Monthly) |
|
|
|
|
|
|
|
|
deposits |
|||||||||||||
|
|
|
|
|
|
|
|
|
|
|
|
|
|
|
|
|
|
|
|
|
||||
|
Radium 226 + 228 |
2018 |
|
|
No |
|
|
3.0 |
|
|
0 |
|
5 |
|
|
Erosion of natural |
||||||||
|
[Combined Radium] (pCi/L) |
|
(Monthly) |
|
|
|
|
|
|
|
|
deposits |
||||||||||||
|
|
|
|
|
|
|
|
|
|
|
|
|
|
|
|
|
|
|
||||||
2 INORGANIC CONTAMINANTS
|
Contaminant and Unit of |
|
|
Dates of |
|
|
MCL |
|
|
5 Level |
|
|
Range |
|
|
|
|
|
|
|
|
Likely Source of |
|
|
|
|
sampling |
|
|
Violation |
|
|
|
|
of |
|
|
MCLG |
|
|
MCL |
|
|
|
|||
|
Measurement |
|
|
|
|
|
|
Detected |
|
|
|
|
|
|
|
|
Contamination |
|
|||||
|
|
|
(mo./yr.) |
|
|
Y/N |
|
|
|
|
Results |
|
|
|
|
|
|
|
|
|
|||
|
|
|
|
|
|
|
|
|
|
|
|
|
|
|
|
|
|
|
|
|
|||
|
|
|
|
|
|
|
|
|
|
|
|
|
|
|
|
|
|
|
|
|
|
Erosion of natural |
|
|
Arsenic (ppb) |
03/18 |
|
|
No |
2.9 |
|
|
0 |
|
10 |
|
|
deposits; runoff from |
|||||||||
|
|
|
|
|
|
|
|
orchards; runoff from |
|||||||||||||||
|
|
|
|
|
|
|
|
|
|
|
|
|
|
|
|
|
|
|
|
|
|
glass and electronics |
|
|
|
|
|
|
|
|
|
|
|
|
|
|
|
|
|
|
|
|
|
|
|
production wastes |
|
|
|
|
|
|
|
|
|
|
|
|
|
|
|
|
|
|
|
|
|
|
|
Discharge of drilling |
|
|
Barium (ppm) |
03/18 |
|
|
No |
0.0065 |
|
|
N/A |
2 |
|
2 |
|
|
wastes; discharge from |
||||||||
|
|
|
|
|
|
|
|
metal refineries; |
|||||||||||||||
|
|
|
|
|
|
|
|
|
|
|
|
|
|
|
|
|
|
|
|
|
|
erosion of natural |
|
|
|
|
|
|
|
|
|
|
|
|
|
|
|
|
|
|
|
|
|
|
|
deposits |
|
|
|
|
|
|
|
|
|
|
|
|
|
|
|
|
|
|
|
|
|
|
|
Erosion of natural |
|
|
|
|
|
|
|
|
|
|
|
|
|
|
|
|
|
|
|
|
|
|
|
deposits; discharge |
|
|
|
|
|
|
|
|
|
|
|
|
|
|
ND- |
|
|
|
|
|
|
|
from fertilizer and |
||
|
Fluoride (ppm) |
03/18 |
|
|
No |
0.432 |
|
|
4 |
|
4.0 |
|
|
aluminum factories. |
|||||||||
|
|
|
|
0.432 |
|
|
|
|
Water additive which |
||||||||||||||
|
|
|
|
|
|
|
|
|
|
|
|
|
|
|
|
|
|
|
|
||||
|
|
|
|
|
|
|
|
|
|
|
|
|
|
|
|
|
|
|
|
|
|
promotes strong teeth |
|
|
|
|
|
|
|
|
|
|
|
|
|
|
|
|
|
|
|
|
|
|
|
when at the optimum |
|
|
|
|
|
|
|
|
|
|
|
|
|
|
|
|
|
|
|
|
|
|
|
level of 0.7 ppm |
|
|
|
|
|
|
|
|
|
|
|
|
|
|
|
|
|
|
|
|
|
|
|
Runoff from fertilizer |
|
|
Nitrate (as Nitrogen) (ppm) |
03/18 |
|
|
No |
0.281 |
|
|
ND- |
|
|
|
|
|
|
|
use; leaching from |
||||||
|
|
|
|
|
10 |
|
10 |
|
|
septic tanks, sewage; |
|||||||||||||
|
|
|
|
0.281 |
|
|
|
|
|||||||||||||||
|
|
|
|
|
|
|
|
|
|
|
|
|
|
|
|
|
|
|
|
erosion of natural |
|||
|
|
|
|
|
|
|
|
|
|
|
|
|
|
|
|
|
|
|
|
|
|
||
|
|
|
|
|
|
|
|
|
|
|
|
|
|
|
|
|
|
|
|
|
|
deposits |
|
|
Sodium (ppm) |
03/18 |
|
|
No |
85.6 |
|
|
N/A |
|
N/A |
160 |
|
|
Salt water intrusion, |
||||||||
|
|
|
|
|
|
|
|
leaching from soil |
|||||||||||||||
|
|
|
|
|
|
|
|
|
|
|
|
|
|
|
|
|
|
|
|
|
|
||
3 STAGE 1 DISINFECTANTS AND DISINFECTION
|
Disinfectant or |
|
|
Dates of |
|
|
MCL |
|
|
5 |
Level |
|
|
Range |
|
|
MCLG |
|
|
|
|
|
Likely Source of |
|
|
Contaminant and Unit of |
|
|
sampling |
|
|
Violation |
|
|
|
|
of |
|
|
Or |
|
|
MCL |
|
|
|
|||
|
|
|
|
|
|
|
Detected |
|
|
|
|
|
|
|
|
Contamination |
|
|||||||
|
Measurement |
|
|
(mo./yr.) |
|
|
Y/N |
|
|
|
|
Results |
|
|
MRDLG |
|
|
|
|
|
|
|||
|
|
|
|
|
|
|
|
|
|
|
|
|
|
|
|
|
|
|
|
|||||
|
|
|
|
|
|
|
|
|
|
|
|
|
|
|
|
|
|
|
|
|
|
|
|
|
|
Bromate (ppm) |
2018 |
|
|
No |
|
|
0.417 |
|
|
|
MCLG = |
|
MCL = |
||||||||||
|
|
(Quarterly) |
|
|
|
|
|
0 |
|
10 |
|
|
water disinfection |
|||||||||||
|
|
|
|
|
|
|
|
|
|
|
|
|
|
|
|
|
||||||||
|
|
|
|
|
|
|
|
|
|
|
|
|
|
|
|
|
|
|
|
|
||||
|
Chloramines (ppm) |
2018 |
|
|
No |
|
|
2.64 |
|
|
|
MRDLG |
|
MRDL |
|
Water additive used to |
||||||||
|
|
(Quarterly) |
|
|
|
|
|
= 4 |
|
= 4.0 |
|
|
control microbes |
|||||||||||
|
|
|
|
|
|
|
|
|
|
|
|
|
|
|
|
|
||||||||
2 0 1 8 C i t y o f C o c o a W a t e r Q u a l i t y R e p o r t |
6 |

|
|
|
|
Dates of |
|
|
TT |
|
|
|
|
|
Range of |
|
|
|
|
|
|
|
|
|
|
|
Contaminant and Unit of |
|
|
|
|
|
|
4 Level |
|
|
Monthly |
|
|
MCLG |
|
|
MCL |
|
|
Likely Source of |
|
||
|
Measurement |
|
|
sampling |
|
|
Violation |
|
|
Detected |
|
|
Removal |
|
|
|
|
|
|
Contamination |
|
||
|
|
|
(mo./yr.) |
|
|
Y/N |
|
|
|
|
|
|
|
|
|
|
|
|
|
||||
|
|
|
|
|
|
|
|
|
|
|
Ratios |
|
|
|
|
|
|
|
|
|
|
||
|
|
|
|
|
|
|
|
|
|
|
|
|
|
|
|
|
|
|
|
|
|
|
|
|
Total Organic Carbon |
2018 |
|
|
No |
1.1 |
|
|
|
N/A |
|
TT |
|
Naturally present in the |
|||||||||
|
|
(Quarterly) |
|
|
|
|
|
|
environment |
||||||||||||||
|
|
|
|
|
|
|
|
|
|
|
|
|
|
|
|
|
|
|
|
||||
6 STAGE 2 DISINFECTANTS AND DISINFECTION
|
Contaminant and |
|
|
Dates of |
|
|
MCL |
|
|
5 Level |
|
|
Range of |
|
|
|
|
|
|
|
|
Likely Source of |
|
|
|
|
sampling |
|
|
Violation |
|
|
|
|
|
|
MCLG |
|
|
MCL |
|
|
|
||||
|
Unit of Measurement |
|
|
|
|
|
|
Detected |
|
|
Results |
|
|
|
|
|
|
Contamination |
|
||||
|
|
|
(mo./yr.) |
|
|
Y/N |
|
|
|
|
|
|
|
|
|
|
|
|
|
||||
|
|
|
|
|
|
|
|
|
|
|
|
|
|
|
|
|
|
|
|
|
|
||
|
Haloacetic Acids |
2018 |
|
|
No |
42.6 |
|
|
|
N/A |
60 |
|
|
||||||||||
|
(HAA5) (ppb) |
|
(Quarterly) |
|
|
|
|
|
|
water disinfection |
|||||||||||||
|
|
|
|
|
|
|
|
|
|
|
|
|
|
|
|
|
|
||||||
|
Total Trihalomethanes |
2018 |
|
|
No |
50.7 |
|
|
|
N/A |
80 |
|
|
||||||||||
|
(TTHM) (ppb) |
|
(Quarterly) |
|
|
|
|
|
|
water disinfection |
|||||||||||||
|
|
|
|
|
|
|
|
|
|
|
|
|
|
|
|
|
|
||||||
|
|
|
|
|
|
|
|
|
|
|
|
|
|
|
|
|
|
|
|
|
|
|
|
LEAD AND COPPER (Tap water samples were collected from sites throughout the community)
|
|
|
|
|
|
|
|
|
|
|
|
|
No. of |
|
|
|
|
|
|
|
|
|
|
|
Contaminant and |
|
|
Dates of |
|
|
AL |
|
|
90th |
|
|
sampling |
|
|
|
|
|
AL |
|
|
Likely Source of |
|
|
|
|
sampling |
|
|
Violation |
|
|
Percentile |
|
|
sites |
|
|
MCLG |
|
|
(Action |
|
|
|
||
|
Unit of Measurement |
|
|
|
|
|
|
|
|
|
|
|
|
|
|
Contamination |
|
||||||
|
|
|
(mo./yr.) |
|
|
Y/N |
|
|
Result |
|
|
exceeding |
|
|
|
|
|
Level) |
|
|
|
||
|
|
|
|
|
|
|
|
|
|
|
|
|
|
|
|
|
|
|
|||||
|
|
|
|
|
|
|
|
|
|
|
|
|
AL |
|
|
|
|
|
|
|
|
|
|
|
|
|
|
|
|
|
|
|
|
|
|
|
|
|
|
|
|
|
|
|
|
Corrosion of household |
|
|
Copper (tap water) |
|
|
|
|
|
|
|
|
|
|
|
|
|
|
|
|
|
|
|
plumbing systems; |
||
|
07/17 |
|
|
No |
0.035 |
|
0 |
|
1.3 |
|
1.3 |
|
|
erosion of natural |
|||||||||
|
(ppm) |
|
|
|
|
|
|
|
|||||||||||||||
|
|
|
|
|
|
|
|
|
|
|
|
|
|
|
|
|
|
|
|
deposits; leaching from |
|||
|
|
|
|
|
|
|
|
|
|
|
|
|
|
|
|
|
|
|
|
|
|
||
|
|
|
|
|
|
|
|
|
|
|
|
|
|
|
|
|
|
|
|
|
|
wood preservatives |
|
|
|
|
|
|
|
|
|
|
|
|
|
|
|
|
|
|
|
|
|
|
|
|
|
|
|
|
|
|
|
|
|
|
|
|
|
|
|
|
|
|
|
|
|
|
|
Corrosion of household |
|
|
Lead (tap water) (ppb) |
07/17 |
|
|
No |
2.2 |
|
1 |
|
0 |
|
15 |
|
|
plumbing systems; |
||||||||
|
|
|
|
|
|
|
|
erosion of natural |
|||||||||||||||
|
|
|
|
|
|
|
|
|
|
|
|
|
|
|
|
|
|
|
|
|
|
||
|
|
|
|
|
|
|
|
|
|
|
|
|
|
|
|
|
|
|
|
|
|
deposits |
|
7 UNREGULATED CONTAMINANT MONITORING REQUIREMENTS 4 (UCMR4)
|
Contaminant and Unit of |
|
|
Dates of |
|
|
5 |
Level |
|
|
Range of |
|
|
|
|
|
|
|
sampling |
|
|
|
|
|
|
Likely Source of Contamination |
|
||||
|
Measurement |
|
|
|
|
Detected |
|
|
Results |
|
|
|
|||
|
|
|
(mo./yr.) |
|
|
|
|
|
|
|
|
||||
|
|
|
|
|
|
|
|
|
|
|
|
|
|
|
|
|
Bromide |
2/18 |
|
|
|
|
|
|
|
|
|
|
|
||
|
(Surface Water Raw) |
|
|
|
89.8 |
|
|
|
Unknown |
||||||
|
11/18 |
|
|
|
|
|
|
||||||||
|
(ppb) |
|
|
|
|
|
|
|
|
|
|
|
|||
|
|
|
|
|
|
|
|
|
|
|
|
|
|
||
|
Bromide |
2/18 |
|
|
|
|
|
|
|
|
|
|
|
||
|
(Ground Water Raw) |
|
|
|
394 |
|
|
|
Unknown |
||||||
|
11/18 |
|
|
|
|
|
|
||||||||
|
(ppb) |
|
|
|
|
|
|
|
|
|
|
|
|||
|
|
|
|
|
|
|
|
|
|
|
|
|
|
||
|
|
|
2/18 |
|
|
|
|
|
|
|
|
|
|
|
|
|
Haloacetic Acids (HAA5) |
3/18 |
|
|
|
38.2 |
|
|
|
||||||
|
(ppb) |
6/18 |
|
|
|
|
|
|
|||||||
|
|
|
|
|
|
|
|
|
|
|
|
||||
|
|
|
8/18 |
|
|
|
|
|
|
|
|
|
|
|
|
|
|
|
2/18 |
|
|
|
|
|
|
|
|
|
|
|
|
|
Haloacetic Acids (HAA6Br) |
3/18 |
|
|
|
17.7 |
|
|
|
||||||
|
(ppb) |
6/18 |
|
|
|
|
|
|
|||||||
|
|
|
|
|
|
|
|
|
|
|
|
||||
|
|
|
8/18 |
|
|
|
|
|
|
|
|
|
|
|
|
|
|
|
2/18 |
|
|
|
|
|
|
|
|
|
|
|
|
|
Haloacetic Acids (HAA9) |
3/18 |
|
|
|
51.0 |
|
|
|
||||||
|
(ppb) |
6/18 |
|
|
|
|
|
|
|||||||
|
|
|
|
|
|
|
|
|
|
|
|
||||
|
|
|
8/18 |
|
|
|
|
|
|
|
|
|
|
|
|
|
Total Organic Carbon |
2/18 |
|
|
|
|
|
|
|
|
|
|
|
||
|
(Surface Water Raw) |
|
19500 |
|
|
|
Naturally present in the environment |
||||||||
|
11/18 |
|
|
|
|
||||||||||
|
(ppb) |
|
|
|
|
|
|
|
|
|
|
|
|||
|
|
|
|
|
|
|
|
|
|
|
|
|
|
||
|
Total Organic Carbon |
2/18 |
|
|
|
|
|
|
|
|
|
|
|
||
|
(Ground Water Raw) |
|
|
|
5560 |
|
|
|
Naturally present in the environment |
||||||
|
11/18 |
|
|
|
|
|
|
||||||||
|
(ppb) |
|
|
|
|
|
|
|
|
|
|
|
|||
|
|
|
|
|
|
|
|
|
|
|
|
|
|
||
7 2 0 1 8 C i t y o f C o c o a W a t e r Q u a l i t y R e p o r t
Footnotes
-
The result in the lowest monthly percentage column is the lowest monthly percentage of samples reported in the Monthly Operating Report meeting the required turbidity limits.
Turbidity is a measure of the cloudiness of the water. We monitor it because it is a good indicator of the effectiveness of our filtration system. High turbidity can hinder the effectiveness of disinfectants. - Results in the Level Detected column for radioactive, inorganic contaminants, and unregulated contaminants are the highest average at any of the sampling points or the highest detected level at any sampling point, depending on the sampling frequency.
-
For Chlorine and Bromate, the Level Detected is the highest running annual average (RAA), computed quarterly, of monthly averages of all samples collected. All of the 2018’s TTHM and HAA5 samples were collected under “Stage 2 Disinfectants and Disinfection
By-Products”. Range of Results is the range of individual sample results (lowest to highest) for all monitoring locations. - The monthly TOC removal ratio is the ratio between the actual TOC removal and the required TOC rule removal requirements.
- Results in the Level Detected column for radioactive, inorganic contaminants, and unregulated contaminants are the highest average at any of the sampling points or the highest detected level at any sampling point, depending on the sampling frequency.
- Stage 2 Disinfectants and Disinfection By- Products includes results from 2017 for LRAA calculation. Level Detected is the highest Locational running annual average (LRAA) for any given sample location during 2018. Range of Results is the range of individual sample results (lowest to highest) for all monitoring locations for 2018.
-
The Cocoa Utilities Department has been monitoring for unregulated contaminants (UCs) as part of a study to help the U.S. Environmental Protection Agency (EPA) determine the occurrence in drinking water of UCs and whether or not these contaminants need to be regulated. At present, no health standards (for example, maximum contaminant levels) have been established for UCs. However, we are required to publish the analytical results of our UC monitoring in our annual water quality report. If you would like more information on the EPA’s Unregulated Contaminants Monitoring Rule, please call the Safe Drinking Water Hotline at (800)
426-4791.
Monitoring and reporting (M/R) of compliance data violation
Due to administrative oversight during a busy part of the year, our office failed to submit 1st, 2nd, and 4th quarter disinfection byproduct monitoring reports in a timely manner. Samples were collected on time, but the reports were submitted late. This violation has no impact on the quality of the water our customers received, and it posed no risk to public health. We have established a report tracking file to ensure that all reporting requirements are met in the future.
We are required to collect dual samples for TTHMs and HAA5s at 12 locations in the distribution system. Samples must be collected on the same day. During the 1st quarter 2018, three locations were sampled for only TTHMs, which resulted in a missed monitoring violation.
HAA5s
2 0 1 8 C i t y o f C o c o a W a t e r Q u a l i t y R e p o r t |
8 |

EPA Information
Cryptosporidium in Drinking Water
Cryptosporidium is a microbial parasite found in surface water throughout the United States. We detected Cryptosporidium in the untreated surface water. We detected this contaminant in two out of 25 samples tested in 2006 through 2008. Although filtration removes Cryptosporidium, the most commonly used filtration methods cannot guarantee 100% removal. Ozone is a powerful disinfectant that effectively destroys Cryptosporidium. The City of Cocoa ozonates all surface water before it is filtered to ensure the highest possible removal rate.
The City of Cocoa sampled Taylor Creek Reservoir for Cryptosporidium in accordance with Florida Department of Environmental Protection (FDEP)’s Long Term 2 (LT2) Enhanced Surface Water Treatment rule. This rule requires that the city sample for Cryptosporidium to provide a baseline for the amount of Cryptosporidium in Taylor Creek Reservoir. This baseline will be used by the EPA to increase treatment techniques or allow established techniques to continue to treat the surface water. Compliance sampling began in October 2006 and ended in October 2008. We began testing for LT2 compliance again in March, 2015 and completed sampling in March, 2017.
We believe it is important for you to know that Cryptosporidium may cause serious illness in
Lead and Drinking Water
If present, elevated levels of lead can cause serious health problems, especially for pregnant women and young children. Lead in drinking water is primarily from materials and components associated with service lines and home plumbing. The Cocoa Utilities Department is responsible for providing high quality drinking water, but cannot control the variety of materials used in plumbing components. When your water has been sitting
for several hours, you can minimize the potential for lead exposure by flushing your tap for 30 seconds to 2 minutes before using water for drinking or cooking. If you are concerned about lead in your water, you may wish to have your water tested. Information on lead in drinking water, testing methods, and steps you can take to minimize exposure is available from the Safe Drinking Water Hotline
Contaminants that may be present in the source water
The sources of drinking water (both tap water and bottled water) include rivers, lakes, streams, ponds, reservoirs, springs, and wells. As water travels over the surface of the land or through the ground, it dissolves naturally occurring minerals and, in some cases, radioactive material, and can pick up substances resulting from the presence of animals or from human activity.
Contaminants that may be present in source water include:
- Microbial contaminants, such as viruses and bacteria, which may come from sewage treatment plants, septic systems, agricultural livestock operations, and wildlife.
-
Inorganic contaminants, such as salts and metals, which can be
naturally-occurring or result from urban stormwater runoff, industrial or domestic wastewater discharges, oil and gas production, mining, or farming. - Pesticides and herbicides, which may come from a variety of sources such as agriculture, urban stormwater runoff, and residential uses.
-
Organic chemical contaminants, including synthetic and volatile organic chemicals, which are
by-products of industrial processes and petroleum production, and can also come from gas stations, urban stormwater runoff, and septic systems. - Radioactive contaminants, which can be naturally occurring or be the result of oil and gas production and mining activities.
To ensure that tap water is safe to drink, the EPA prescribes regulations, which limit the amount of certain contaminants in water provided by public water systems. The Food and Drug Administration
9 2 0 1 8 C i t y o f C o c o a W a t e r Q u a l i t y R e p o r t

(FDA) regulations establish limits for contaminants in bottled water, which must provide the same protection for public health.
Drinking water, including bottled water, may reasonably be expected to contain at least small amounts of some contaminants. The presence of contaminants does not necessarily indicate that the water poses a health risk. More information about contaminants and potential health effects can be obtained by calling the Environmental Protection Agency’s Safe Drinking Water Hotline at
Important Health Information
Some people may be more vulnerable to contaminants in drinking water than the general population.
Water Conservation
4 Reasons Why Water Conservation is Important Everyone
Reason #1: It minimizes the effects of drought and water shortages. Even though our need for fresh water sources is always increasing because of population and industry growth, the supply we have stays constant. Even though water eventually returns to Earth through the water cycle, it's not always returned to the same spot, or in the same quantity and quality. By reducing the amount of water we use, we can better protect against future drought years.
Reason #2: Using less water keeps money in your pocket. By utilizing basic water conservation techniques you are able to save thousands of gallons of water each year. You do the math, use less water and the water company
charges you less money. That sounds like a good deal all around.
Reason #3: Conserving water can also save energy. Energy is required to run the equipment that treats and pumps the water from water treatment plant into your home or office. So saving water means using less energy which reduces your carbon footprint and helps the country become more energy independent.
Reason #4: Saving water helps to preserve our environment. Reducing our water usages reduces the energy required to process and deliver it to homes, businesses, farms, and communities, which, in turn, helps to reduce pollution and conserve fuel resources. In some cases, using excess amounts of water puts a strain on septic and sewage systems.
Water conservation measures are an important first step in protecting our water supply. Such measures help to preserve the supply of our source water and also save you money by reducing your water bill.
Other ways that you can help conserve water can be found at www.cocoafl.org/conservation,
Environmental Protection
You can help protect water quality. Quick things you can do!
Protecting drinking water sources requires the combined efforts of many partners. We can all do our part by:
- Using and disposing of harmful materials properly.
- Not over using pesticides or fertilizers.
- Not flushing unused/unwanted medications down toilets or sink drains.
We at the Cocoa Utilities Department would like you to understand the efforts we make to continually improve the water treatment process and protect our water resources. We are committed to insuring the quality of your water. If you have any questions or concerns about the information provided please feel free to call 321-
2 0 1 8 C i t y o f C o c o a W a t e r Q u a l i t y R e p o r t |
10 |
Contaminants
City of Cocoa
EWG's drinking water quality report shows results of tests conducted by the water utility and provided to the Environmental Working Group by the Florida Department of Environmental Protection, as well as information from the U.S. EPA Enforcement and Compliance History database (ECHO). For the latest quarter assessed by the U.S. EPA (January 2019 - March 2019), tap water provided by this water utility was in compliance with federal health-based drinking water standards.
Utility details
- Serves: 285352
- Data available: 2012-2017
- Data Source: Surface water
- Total: 16
Contaminants That Exceed Guidelines
- Arsenic
- Chromium (hexavalent)
- Radium%2C combined (-226 & -228)
- Total trihalomethanes (TTHMs)
Other Detected Contaminants
- Barium
- Carbon tetrachloride
- Chlorate
- Cyanide
- Fluoride
- Haloacetic acids (HAA5)
- Mercury (inorganic)
- Molybdenum
- Nitrate
- Strontium
- Vanadium
- Xylenes (total)
Reminder
Always take extra precautions, the water may be safe to drink when it leaves the sewage treatment plant but it may pick up pollutants during its way to your tap. We advise that you ask locals or hotel staff about the water quality. Also, note that different cities have different water mineral contents.