Table of Contents
Can You Drink Tap Water in Charleston?
Yes, Charleston's tap water is generally considered safe to drink as Charleston has no active health based violations of the Safe Drinking Water Act (SDWA) that we are aware of. Other factors such as lead piping in a home, or low levels of pollutants on immunocompromised individuals, should also be considered, however. To find more recent info we might have, you can check out our boil water notice page, the city's water provider website, or Charleston's local Twitter account.
According the EPA’s ECHO database, from April 30, 2019 to June 30, 2022, Charleston's water utility, Charleston Water System (Sc1010001), had 0 violations of the Safe Drinking Water Act. For more details on the violations, please see our violation history section below. This assessment is based on the Charleston Water System (Sc1010001) water system, other water systems in the city may have different results.
While tap water that meets the EPA health guidelines generally won’t make you sick to your stomach, it can still contain regulated and unregulated contaminants present in trace amounts that could potentially cause health issues over the long-run. These trace contaminants may also impact immunocompromised and vulnerable individuals.
The EPA is reviewing if it’s current regulations around pollutant levels in tap water are strict enough, and the health dangers posed by unregulated pollutants, like PFAS.
Water Quality Report for Charleston Tap Water
The most recent publicly available numbers for measured contaminant levels in Charleston tap water are in its 2020 Water Quality Report. As you can see, there are levels which the EPA considers to be acceptable, but being below the maximum allowable level doesn’t necessarily mean the water is healthy.
Lead in tap water, for example, is currently allowed at up to 15ppb by the EPA, but it has set the ideal goal for lead at zero. This highlights how meeting EPA standards doesn’t necessarily mean local tap water is healthy.
EPA regulations continue to change as it evaluates the long term impacts of chemicals and updates drinking water acceptable levels. The rules around arsenic, as well as, lead and copper are currently being re-evaluated.
There are also a number of "emerging" contaminants that are not currently. For example, PFAS (Per- and polyfluoroalkyl substances), for which the EPA has issued a health advisory. PFAS are called "forever chemicals" since they tend not to break down in the environment or the human body and can accumulate over time.
We recommend looking at the contaminants present in Charleston's water quality reports, or getting your home's tap water tested to see if you should be filtering your water.
Charleston Tap Water Safe Drinking Water Act Violation History - Prior 10 Years
Below is a ten year history of violations for the water system named Charleston Water System (Sc1010001) for Charleston in South Carolina. For more details please see the "What do these Violations Mean?" section below.
Is there Lead in Charleston Water?
Based on the EPA’s ECHO Database, 90% of the samples taken from the Charleston water system, Charleston Water System (Sc1010001), between sample start date and sample end date, were at or below, 0.0023 mg/L of lead in Charleston water. This is 15.3% of the 0.015 mg/L action level. This means 10% of the samples taken from Charleston contained more lead.
While Charleston water testing may have found 0.0023 mg/L of lead in its water, that does not mean your water source has the same amount. The amount of lead in water in a city can vary greatly from neighborhood to neighborhood, or even building to building. Many buildings, particularly older ones, have lead pipes or service lines which can be a source of contamination. To find out if your home has lead, we recommend getting you water tested.
No amount of lead in water is healthy, only less dangerous. As lead accumulates in our bodies over time, even exposure to relatively small amounts can have negative health effects. For more information, please check out our Lead FAQ page.
Are there PFAS in Charleston Tap Water?
Currently, testing tap water for PFAS isn’t mandated on a national level. We do have a list of military bases where there have been suspected or confirmed leaks. There appears to be at least one military base - Charleston NSY - near Charleston with suspected leaks.
With many potential sources of PFAS in tap water across the US, the best information we currently have about which cities have PFAS in their water is this ewg map, which you can check to see if Charleston has been evaluated for yet.
Our stance is better safe than sorry, and that it makes sense to try to purify the tap water just in case.
What do these Violations Mean?
Safe Drinking Water Act Violations categories split into two groups, health based, and non-health based. Generally, health based violations are more serious, though non-health based violations can also be cause for concern.
Health Based Violations
- Maximum contaminant levels (MCLs) - maximum allowed contaminant level was exceeded.
- Maximum residual disinfectant levels (MRDLs) - maximum allowed disinfectant level was exceeded.
- Other violations (Other) - the exact required process to reduce the amounts of contaminants in drinking water was not followed.
Non-Health Based Violations
- Monitoring and reporting violations (MR, MON) - failure to conduct the required regular monitoring of drinking water quality, and/or to submit monitoring results on time.
- Public notice violations (Other) - failure to immediately alert consumers if there is a serious problem with their drinking water that may pose a risk to public health.
- Other violations (Other) - miscellaneous violations, such as failure to issue annual consumer confidence reports or maintain required records.
SDWA Table Key
| Field | Description |
|---|---|
| Compliance Period | Dates of the compliance period. |
| Status |
Current status of the violation.
|
| Health-Based? | Whether the violation is health based. |
| Category Code |
The category of violation that is reported.
|
| Code | A full description of violation codes can be accessed in the SDWA_REF_CODE_VALUES (CSV) table. |
| Contaminant Code | A code value that represents a contaminant for which a public water system has incurred a violation of a primary drinking water regulation. |
| Rule Code |
Code for a National Drinking Water rule.
|
| Rule Group Code |
Code that uniquely identifies a rule group.
|
| Rule Family Code |
Code for rule family.
|
For more clarification please visit the EPA's data dictionary.
Charleston Water - Frequently Asked Questions
| By Mail: | 103 SAINT PHILLIPS CHARLESTON, SC, 29402 |
Existing customers can login to their Charleston Water System (Sc1010001) account to pay their Charleston water bill by clicking here.
If you want to pay your Charleston Water System (Sc1010001) bill online and haven't made an account yet, you can create an account online. Please click here to create your account to pay your Charleston water bill.
If you don't want to make an account, or can't remember your account, you can make a one-time payment towards your Charleston water bill without creating an account using a one time payment portal with your account number and credit or debit card. Click here to make a one time payment.
Moving to a new house or apartment in Charleston means you will often need to put the water in your name with Charleston Water System (Sc1010001). In order to put the water in your name, please click the link to the start service form below. Start service requests for water bills typically take two business days.
Leaving your house or apartment in Charleston means you will likely need to take your name off of the water bill with Charleston Water System (Sc1010001). In order to take your name off the water bill, please click the link to the stop service form below. Stop service for water bills requests typically take two business days.
The estimated price of bottled water
$1.64 in USD (1.5-liter)
USER SUBMITTED RATINGS
- Drinking Water Pollution and Inaccessibility
- Water Pollution
- Drinking Water Quality and Accessibility
- Water Quality
The above data is comprised of subjective, user submitted opinions about the water quality and pollution in Charleston, measured on a scale from 0% (lowest) to 100% (highest).
Related FAQS
Charleston Water Quality Report (Consumer Confidence Report)
The EPA mandates that towns and cities consistently monitor and test their tap water. They must report their findings in an annual Consumer Confidence Report. Below is the most recent water quality report from Charleston's Water. If you would like to see the original version of the report, please click here.
2020 |
Charleston Water System |
Water Quality Report |
We met or surpassed all water quality requirements.
Voluntary Testing of Unregulated Compounds |
|
|
All were below their EPA Health Advisory or drinking water standard. |
|||||||||||
|
|
|
|
|
|
|
|
|
|
|
|
|
|
|
Compounds With Health Advisories |
Units |
Aug |
Nov |
Feb |
May |
Oct |
Nov |
Feb |
May |
EPA Health |
Secondary Drinking |
Notes |
||
2018 |
2018 |
2019 |
2019 |
2020 |
2021 |
2022 |
2023 |
Advisory |
Water Standards |
|||||
|
|
|
|
|||||||||||
|
|
|
|
|
|
|
|
|
|
|
|
|
|
|
|
ppt |
NA |
NA |
NA |
8.7 |
NA |
|
|
|
200,000* |
|
Compounds Analyzed: |
|
|
|
|
|
|
|
|
|
|
|
|
|
|
Aug. 2018: 597 |
Nov. 2021:, |
|
Aluminum |
ppb |
74 |
58 |
38 |
35 |
70 |
|
|
|
NA |
50 to 200 |
|||
|
|
|
Nov. 2018: 595 |
Feb. 2022: |
||||||||||
|
|
|
|
|
|
|
|
|
|
|
|
|||
Atrazine |
ppt |
22 |
19 |
7.2 |
16 |
24 |
|
|
|
700,000* |
|
|||
|
|
|
|
Feb. 2019: 627 |
May 2023: |
|||||||||
|
|
|
|
|
|
|
|
|
|
|
|
|||
Barium |
ppb |
14 |
12 |
16 |
17 |
14 |
|
|
|
7,000* |
|
May 2019: 601 |
|
|
|
|
|
|
|
|
|
|
|
|
|
|
Oct. 2020: 573 |
|
|
Bromodichloromethane |
ppb |
5.6 |
3.7 |
3.3 |
2.9 |
5.2 |
|
|
|
100* |
|
|
||
|
|
|
|
|
|
|
|
|
|
|
|
Definitions: |
|
|
Chloroform |
ppb |
7.2 |
2.7 |
2.6 |
3.2 |
7.1 |
|
|
|
350* |
|
|
||
|
|
|
|
|
|
|
|
|
|
|
|
EPA Heath Advisory (HA): An estimate of acceptable |
||
Dibromochloromethane |
ppb |
2.6 |
2.0 |
1.6 |
1.5 |
1.9 |
|
|
|
700* |
|
|||
|
|
|
|
drinking water levels for a substance based on |
||||||||||
|
|
|
|
|
|
|
|
|
|
|
|
health effects info. It’s not a legally enforceable |
||
Formaldehyde |
ppb |
NA |
NA |
NA |
7.1 |
7.3 |
|
|
|
7000* |
|
|||
|
|
|
|
standard or regulation, but rather a technical |
||||||||||
|
|
|
|
|
|
|
|
|
|
|
|
|||
Diuron |
ppt |
NA |
NA |
NA |
NA |
82 |
|
|
|
100,000* |
|
guidance for regulators. |
|
|
|
|
|
|
|
|
|
|
|
|
|
|
|
|
|
Manganese |
ppb |
13 |
6.4 |
3.3 |
9.6 |
8.5 |
|
|
|
1,600* |
|
Exclusions: |
|
|
|
|
|
|
|
|
|
|
|
|
|
|
|||
Perchlorate |
ppb |
NA |
NA |
0.13 |
0.12 |
NA |
|
|
|
25* |
|
|||
|
|
|
|
because there are no analytical methods to do so. |
||||||||||
PFOA |
ppt |
5.0 |
4.1 |
4.4 |
5.3 |
4.3 |
|
|
|
70** |
|
Footnotes: |
|
|
|
|
|
|
|
|
|
|
|
|
|
|
|||
PFOS |
ppt |
9.7 |
6.1 |
6.3 |
7.0 |
7.5 |
|
|
|
|
*EPA Drinking Water Equivalent Level (DWEL). |
|||
|
|
|
|
|
||||||||||
|
|
|
|
|
|
|
|
|
|
|
|
**EPA Health Advisory, as data is not available. |
||
Simazine |
ppt |
NA |
6.9 |
14 |
16 |
NA |
|
|
|
700,000* |
|
|||
|
|
|
|
|
|
|||||||||
|
|
|
|
|
|
|
|
|
|
|
|
|
|
|
Strontium |
ppb |
53 |
41 |
43 |
53 |
46 |
|
|
|
20,000* |
|
Position Statements: |
|
|
|
|
|
|
|
|
|
|
|
|
|
|
To view our position statements on Fluoride and |
||
Zinc |
ppb |
NA |
NA |
6.3 |
NA |
NA |
|
|
|
10,000* |
|
|||
|
|
|
|
|
|
|
|
|
|
|
|
Unregulated Compounds, please go to |
||
Water Characteristics
Parameter |
Units |
2020 Average |
Highest Level |
|
Recommended by EPA |
||||
|
|
|
||
|
|
|
|
|
Chloride |
ppm |
13 |
250 |
|
|
|
|
|
|
Color |
PCU |
<1 |
15 |
|
|
|
|
|
|
Iron |
ppm |
<0.10 |
0.3 |
|
|
|
|
|
|
Manganese |
ppm |
<0.05 |
0.05 |
|
|
|
|
|
|
Total Dissolved Solids (TDS) |
ppm |
93 |
500 |
|
|
|
|
|
|
Sodium |
ppm |
8 |
|
|
|
|
|
|
|
Alkalinity |
ppm |
28 |
|
|
|
|
|
|
|
Conductivity |
µmhos/cm |
184 |
|
|
|
|
|
No Standard |
|
Hardness |
ppm |
58 (3.38 gpg) |
||
|
|
|
|
|
|
ppm |
1.2 |
|
|
|
|
|
|
|
Silica |
ppm |
8.3 |
|
|
Temperature |
F |
71.2° (22°C) |
|
|
|
|
|
|
Abbreviations:
ppm: Parts per million PCU: Platinum Cobalt Units gpg: Grains per gallon µmhos/cm: Micromohs/cm
These parameters affect aesthetics, such as taste, odor, hardness, etc. The EPA has secondary
standards for some of these parameters, which are recommended guidelines.
This report is published annually in May.
Questions / Extra Copies:
Communications department: (843) 727-7146
En Español:
Este informe contiene información muy importante sobre su agua beber. Tradúzcalo ó hable con alguien que lo entienda bien.
Get Involved:
Our Board of Commissioners meets monthly and meetings are open to the public. Citizen participation is welcomed. Meetings are typically held the fourth Tuesday of every month at 9 a.m. at
103 St. Philip Street. More information: www.charlestonwater.com.
Public Water System ID#:
1010001
@CharlestonWater
@ChasWaterSystem
YouTube.com/CharlestonWater
www.charlestonwater.com
Charleston Water System
24/7 Customer Service: (843) 727-6800
Main Office (Downtown) |
North Area Office |
103 St. Philip Street |
6296 Rivers Avenue |
Charleston SC, 29403 |
North Charleston, SC 29418 |
Additional unregulated compounds detected during unregulated compound testing. |
|
|
|
|
|
|
www.charlestonwater.com/positionstatement. |
|||||
|
|
|
|
|
|
|
|
|
|
|
|
|
1,4 Dioxane |
ppb |
0.11 |
0.14 |
0.32 |
0.33 |
0.11 |
|
|
|
NA |
|
|
|
|
|
|
|
|
|
|
|
|
|
|
|
6:2 Fluorotelomer sulfonic acid (6:2 FTS) |
ppt |
NA |
4.0 |
NA |
NA |
NA |
|
|
|
NA |
|
|
|
|
|
|
|
|
|
|
|
|
|
|
|
|
ppt |
NA |
32 |
160 |
88 |
46 |
|
|
|
NA |
|
|
|
|
|
|
|
|
|
|
|
|
|
|
|
Atenolol |
ppt |
NA |
NA |
NA |
5.8 |
NA |
|
|
|
NA |
|
|
|
|
|
|
|
|
|
|
|
|
|
|
|
Boron |
ppb |
37 |
32 |
26 |
22 |
28 |
|
|
|
NA |
|
|
|
|
|
|
|
|
|
|
|
|
|
|
|
Chromium, hexavalent |
ppb |
0.06 |
0.06 |
0.06 |
0.06 |
0.33 |
|
|
|
NA |
|
|
|
|
|
|
|
|
|
|
|
|
|
|
|
DEA (Diethanolamine) |
ppt |
NA |
NA |
NA |
NA |
6.2 |
|
|
|
NA |
|
|
|
|
|
|
|
|
|
|
|
|
|
|
|
DEET |
ppt |
NA |
12 |
NA |
NA |
21 |
|
|
|
NA |
|
|
|
|
|
|
|
|
|
|
|
|
|
|
|
Iohexal |
ppt |
NA |
19 |
19 |
51 |
21 |
|
|
|
NA |
|
|
|
|
|
|
|
|
|
|
|
|
|
|
|
Lincomycin |
ppt |
NA |
24 |
NA |
NA |
NA |
|
|
|
NA |
|
|
|
|
|
|
|
|
|
|
|
|
|
|
|
NDMA |
ppt |
7.5 |
3.4 |
5.6 |
5.1 |
7.7 |
|
|
|
NA |
|
|
|
|
|
|
|
|
|
|
|
|
|
|
|
NMEA |
ppt |
NA |
2.5 |
NA |
NA |
NA |
|
|
|
NA |
|
|
|
|
|
|
|
|
|
|
|
|
|
|
|
PFBA |
ppt |
7.0 |
NA |
NA |
NA |
8 |
|
|
|
NA |
|
|
|
|
|
|
|
|
|
|
|
|
|
|
|
PFBS |
ppt |
3.8 |
4.0 |
3.2 |
3.5 |
2.9 |
|
|
|
NA |
|
|
|
|
|
|
|
|
|
|
|
|
|
|
|
PFHpA |
ppt |
3.2 |
2.9 |
2.3 |
2.8 |
2.6 |
|
|
|
NA |
|
|
|
|
|
|
|
|
|
|
|
|
|
|
|
PFHxA |
ppt |
5.6 |
5.7 |
4.3 |
5.6 |
4.9 |
|
|
|
NA |
|
|
|
|
|
|
|
|
|
|
|
|
|
|
|
PFHxS |
ppt |
3.3 |
2.8 |
2.1 |
2.2 |
2.7 |
|
|
|
NA |
|
|
|
|
|
|
|
|
|
|
|
|
|
|
|
PFPeA |
ppt |
7.5 |
7.5 |
4.7 |
5.8 |
5.5 |
|
|
|
NA |
|
|
|
|
|
|
|
|
|
|
|
|
|
|
|
Quinoline |
ppt |
NA |
19 |
NA |
NA |
NA |
|
|
|
NA |
|
|
|
|
|
|
|
|
|
|
|
|
|
|
|
Sucralose |
ppt |
NA |
950 |
640 |
580 |
430 |
|
|
|
NA |
|
|
|
|
|
|
|
|
|
|
|
|
|
|
|
Tetrahydrofuran |
ppb |
NA |
NA |
NA |
6.1 |
NA |
|
|
|
NA |
|
|
|
|
|
|
|
|
|
|
|
|
|
|
|
Theobromine |
ppt |
NA |
NA |
16 |
NA |
NA |
|
|
|
NA |
|
|
|
|
|
|
|
|
|
|
|
|
|
|
|
Total Trihalomethanes |
ppb |
15.4 |
8.4 |
7.5 |
7.6 |
14.2 |
|
|
|
NA |
|
|
|
|
|
|
|
|
|
|
|
|
|
|
|
EPA’s 2020 Unregulated Contaminant Monitoring Rule (UCMR4)
Compound |
Units |
RawWater |
|
|
FinishedWater |
|
DistributionWater |
|||
|
|
|
|
|
|
|
|
|
|
|
|
|
Average |
|
Range |
Average |
|
Range |
Average |
|
Range |
|
|
|
|
|
|
|
|
|
|
|
HAA5 |
ppb |
|
|
|
|
|
|
12.19 |
|
8.14 - 18.44 |
|
|
|
|
|
|
|
|
|
||
|
|
|
|
|
|
|
|
|
|
|
HAA6Br |
ppb |
|
|
|
|
|
|
5.89 |
|
4.34 - 8.42 |
|
|
|
|
|
|
|
|
|
||
|
|
|
|
|
|
|
|
|
|
|
HAA9 |
ppb |
|
|
|
|
|
|
17.28 |
|
12.25 - 25.86 |
|
|
|
|
|
|
|
|
|
||
|
|
|
|
|
|
|
|
|
|
|
Bromide |
ppb |
0.04 |
|
0.03 - 0.04 |
|
|
|
|
|
|
|
|
|
|
|
|
|
|
|
||
|
|
|
|
|
|
|
|
|
|
|
Manganese |
ppb |
|
|
|
9.38 |
|
6.15 - 14.4 |
|
|
|
|
|
|
|
|
|
|
|
|
||
|
|
|
|
|
|
|
|
|
|
|
Total Organic Carbon (TOC) |
ppm |
7.45 |
|
6.46 - 7.98 |
|
|
|
|
|
|
|
|
|
|
|
|
|
|
|
||
|
|
|
|
|
|
|
|
|
|
|
|
|
Regulatory Testing |
|
|
|
|
|
These were the only compounds found in our water and all were below the regulatory limit. |
|||||||
|
|
|
|
|
|
|
|
|
|
|
|
|
|
||
|
|
|
Required Regulatory Report |
|
Maximum Contaminant Level |
Maximum Contaminant |
|
Actual Level in CWS Water for 2020 |
Year |
|
Possible Sources in Water |
||||
|
|
|
|
(MCL) set by EPA |
Level Goal (MCLG) |
|
Sampled |
|
|||||||
|
|
|
|
|
|
|
|
|
|
|
|||||
|
|
|
|
|
|
|
|
|
|
|
|
|
|
|
|
|
|
|
Turbidity |
|
|
Requires a specific treatment technique; |
|
|
|
0.12 NTU Highest level detected |
2020 |
|
|
||
|
|
|
A measure of the amount of suspended particles in the water (cloudiness); an indicator of overall water |
|
NA |
|
100% of monthly samples met the limit |
|
Soil runoff |
||||||
|
|
|
95% of monthly samples must be less than 0.3 NTU |
|
|
|
|||||||||
|
|
|
quality and filtration effectiveness. |
|
|
|
|
|
Range: 0.07 - 0.12 |
|
|
|
|||
|
|
|
|
|
|
|
|
|
|
|
|
|
|||
|
|
|
|
|
|
|
|
|
|
|
|
|
|
|
|
|
|
|
Cryptosporidium |
|
|
None |
|
Zero Cryptosporidium oocysts |
|
0.0 |
|
2020 |
|
Human and animal sources |
|
|
|
|
A parasite spread through human and animal waste that causes gastrointestinal illness. |
|
|
|
per 1 liter of water |
|
|
|
|||||
|
|
|
|
|
|
|
|
|
|
|
|
|
|||
|
|
|
|
|
|
|
|
|
|
|
|
|
|
|
|
|
|
|
Giardia |
|
|
None |
|
|
Zero Giardia oocysts |
|
0.0 |
|
2020 |
|
Human and animal sources |
|
|
|
A parasite spread through human and animal waste that causes gastrointestinal illness. |
|
|
per 1 liter of water |
|
|
|
||||||
|
|
|
|
|
|
|
|
|
|
|
|
||||
|
|
|
|
|
|
|
|
|
|
|
|
|
|
|
|
|
|
|
Copper |
|
|
90th percentile of all samples collected |
|
|
|
0.12 ppm |
|
2018 |
|
Corrosion of household plumbing materials |
|
|
|
|
|
|
|
1.3 ppm |
|
(No samples exceeded the action level) |
|
||||||
|
|
|
A metal widely used in household plumbing that may corrode into water. |
|
must be less than the 1.3 ppm action level |
|
|
|
EPA requires testing for copper and lead once every three years. |
||||||
|
Compounds |
|
|
|
|
Range: 0 to 0.18 ppm |
|
|
|||||||
|
|
|
|
|
|
|
|
|
|
|
|
||||
|
Lead |
|
|
90th percentile of all samples collected |
|
|
|
90th percentile = 2.3 ppb |
2018 |
|
Corrosion of household plumbing materials |
||||
|
|
|
|
|
|
|
|
|
|||||||
|
|
|
A metal no longer used in water pipes, but may be present in plumbing fixtures or old pipes; may |
|
|
0 ppb |
|
(No samples exceeded the action level) |
|
||||||
|
|
|
|
must be less than the 15 ppb action level |
|
|
|
EPA requires testing for copper and lead once every three years. |
|||||||
|
|
|
corrode into water. |
|
|
|
|
|
Range: 0 to 11 ppb |
|
|
||||
|
|
|
|
|
|
|
|
|
|
|
|
|
|||
|
|
|
|
|
|
|
|
|
|
|
|
|
|
|
|
|
Inorganic |
Nitrate/Nitrite |
|
|
|
|
|
|
|
0.11 ppm in source water |
2020 |
|
Runoff from fertilizers |
||
|
Fluoride |
|
|
|
|
|
|
|
|
||||||
|
|
|
Nitrates and nitrites are |
10 ppm |
|
|
10 ppm |
|
0.18 ppm |
|
|
||||
|
|
|
of unwanted nutrients. |
|
|
|
|
|
|
|
|
|
|
|
|
|
|
|
A substance that is naturally occurring in some water sources, particularly groundwater. It is also added to |
4 ppm |
|
|
4 ppm |
|
0.50 ppm in finished |
water |
2020 |
|
Naturally occurring in source water and adjusted during treatment |
||
|
|
|
|
|
|
|
to prevent tooth decay. |
||||||||
|
|
|
drinking water to help prevent tooth decay. |
|
|
|
|
|
|
|
Range 0.45 to 0.67 ppm |
|
|
||
|
|
|
|
|
|
|
|
|
|
|
|
|
|||
|
|
|
|
|
|
|
|
|
|
|
|
|
|
|
|
|
Disinfectants |
Chlorine Dioxide |
|
|
800 ppb |
|
|
800 ppb |
|
260 ppb |
|
2020 |
|
Added for disinfection |
|
|
A disinfection agent added in small amounts to protect against microbes. |
|
|
|
|
Range: 0 to 260 ppb |
|
||||||||
|
|
|
|
|
|
|
|
||||||||
|
|
|
|
|
|
|
|
|
|
|
|
||||
|
|
|
|
|
|
|
|
|
|
|
|
|
|
|
|
|
|
|
Chloramine Residual |
|
|
4 ppm MRDL |
|
|
4 ppm MRDLG |
|
3.0 ppm Running Annual Average |
2020 |
|
Added for disinfection |
|
|
|
|
A compound of chlorine and ammonia added in small amounts to treated water to protect against |
|
|
|
|
|
|||||||
|
|
|
|
|
|
|
Range: 2.0 – 3.0 ppm |
|
|||||||
|
|
|
microbes. |
|
|
|
|
|
|
|
|
|
|
||
|
|
|
|
|
|
|
|
|
|
|
|
|
|
|
|
|
|
|
|
|
|
|
|
|
|
|
|
|
|
|
|
|
|
|
Total Trihalomethanes (Stage 2) |
|
|
Locational Running Annual Average |
|
NA |
|
Highest level detected: 15.93 ppb |
2020 |
|
Byproduct of disinfection |
||
|
|
|
Stage 2 of the Disinfectants and Disinfection Byproducts Rule requires the locational running annual |
|
|
|
|
||||||||
|
Disinfection |
|
|
must be below 80 ppb |
|
|
Range: 4.32 – 15.93 ppb |
|
|||||||
|
Byproducts |
average (LRAA) for each sampling location to be below the MCL. CWS has eight sampling locations. |
|
|
|
|
|
|
|
||||||
|
|
|
|
|
|
|
|
|
|
|
|
||||
|
|
|
|
|
|
|
|
|
|
|
|
|
|
||
|
Total Haloacetic Acids (Stage 2) |
|
|
Locational Running Annual Average |
|
NA |
|
Highest level detected: 20.86 ppb |
2020 |
|
Byproduct of disinfection |
||||
|
|
|
|
|
|
|
|
||||||||
|
|
|
Stage 2 of the Disinfectants and Disinfection Byproducts Rule requires the locational running annual |
|
|
|
|
||||||||
|
|
|
|
must be below 60 ppb |
|
|
Range: 5.8 – 20.86 ppb |
|
|||||||
|
|
|
average (LRAA) for each sampling location to be below the MCL. CWS has eight sampling locations. |
|
|
|
|
|
|
|
|||||
|
|
|
|
|
|
|
|
|
|
|
|
|
|
||
|
|
|
|
|
|
|
|
|
|
|
|
|
|
|
|
|
|
|
Chlorite |
|
|
1 ppm |
|
|
0.8 ppm |
|
Highest level detected: 0.73 ppm |
2020 |
|
Byproduct of disinfection |
|
|
|
|
A byproduct formed when chlorine dioxide is used to disinfect water. |
|
|
|
|
Range: <0.02 – 0.73 ppm |
|
||||||
|
|
|
|
|
|
|
|
|
|
|
|
||||
|
|
|
|
|
|
|
|
|
|
|
|
|
|
|
|
|
Organics& |
|
Total Organic Carbon (TOC) |
|
|
|
|
Required % removal varies from |
|
Removal Range: 57% to 65% |
2020 |
|
Naturally present in the environment |
||
|
Bacteria |
The measure of organic substances in a body of water, mostly from naturally occurring sources such as |
|
No MCL; EPA requires a specific treatment technique. |
35% - 55% TOC removal, |
|
|
||||||||
|
|
|
61.4 % removed |
|
|
||||||||||
|
A group of bacteria whose presence in water indicates possible contamination with soil or waste from |
|
|
|
|
0% |
|
|
2020 |
|
|
||||
|
|
|
|
|
|
Range: 0 – 2.4% |
|
|
|||||||
|
|
|
plant material. TOC provides a measurement for the potential formation of disinfection byproducts. |
|
|
|
depending on source water quality |
|
|
|
|
|
|
||
|
|
|
Total Coliform Bacteria |
|
|
Presence of coliform bacteria greater than or equal to 5% |
|
|
|
2.4% highest % of positive monthly samples |
|
|
Naturally present in the environment |
||
|
|
|
|
|
|
|
|
|
|
|
|
|
|||
|
|
|
warm blooded animals. |
|
|
of monthly samples |
|
|
|
|
All repeat samples were satisfactory |
|
|
|
|
|
|
|
|
|
|
|
|
|
|
|
|
|
|||
|
|
|
|
|
|
|
|
|
|
|
|
|
|
||
|
Abbreviations: ppm: Parts per million (mg/L) |
ppb: Parts per billion (ug/L) |
ppt: Parts per trillion (ng/L) |
LRAA: Locational Running Annual Average |
|
RAA: Running Annual Average |
NTU: Nephelometric Turbidity Units |
|
|||||||
|
|
|
|
|
|
|
|
|
|
|
|
|
|
|
|
|
|
|
|
|
|
|
|
|
|
|
|
|
|
|
|
|
|
|
|
|
|
|
|
DEFINITIONS |
|
|
|
|
|
|
|
Maximum Contaminant Level Goal (MCLG) |
|
|
|
|
Treatment Technique (TT) |
|
|
|
|
||||||
The level of a contaminant in drinking water below which there is no known or expected risk to health. MCLGs allow for a |
A required process intended to reduce the level of a contaminant in drinking water. |
||||||||||||||
margin of safety. |
|
|
|
|
|
Maximum Residual Disinfectant Level (MRDL) |
|
|
|
||||||
Maximum Contaminant Level (MCL) |
|
|
|
|
|
|
|
|
|||||||
|
|
|
|
|
The highest level of disinfectant allowed in drinking water. There is convincing evidence that addition of a disinfectant is |
||||||||||
The highest level of a contaminant that is allowed in drinking water. MCLs are set as close to the MCLGs as feasible using |
necessary for control of microbial contaminants. |
|
|
|
|||||||||||
the best available treatment technology. |
|
|
|
|
|
Maximum Residual Disinfectant Level Goal (MRDLG) |
|
|
|
||||||
Action Level (AL) |
|
|
|
|
|
|
|
|
|||||||
|
|
|
|
|
The level of a drinking water disinfectant below which there is no known or expected risk to health. MRDLGs do not reflect |
||||||||||
The concentration of a contaminant, which, if exceeded, triggers treatment or other requirements that a water system |
the benefits |
of the use of disinfectants to control microbial contamination. |
|
||||||||||||
must follow. |
|
|
|
|
|
|
|
|
|
|
|
|
|||
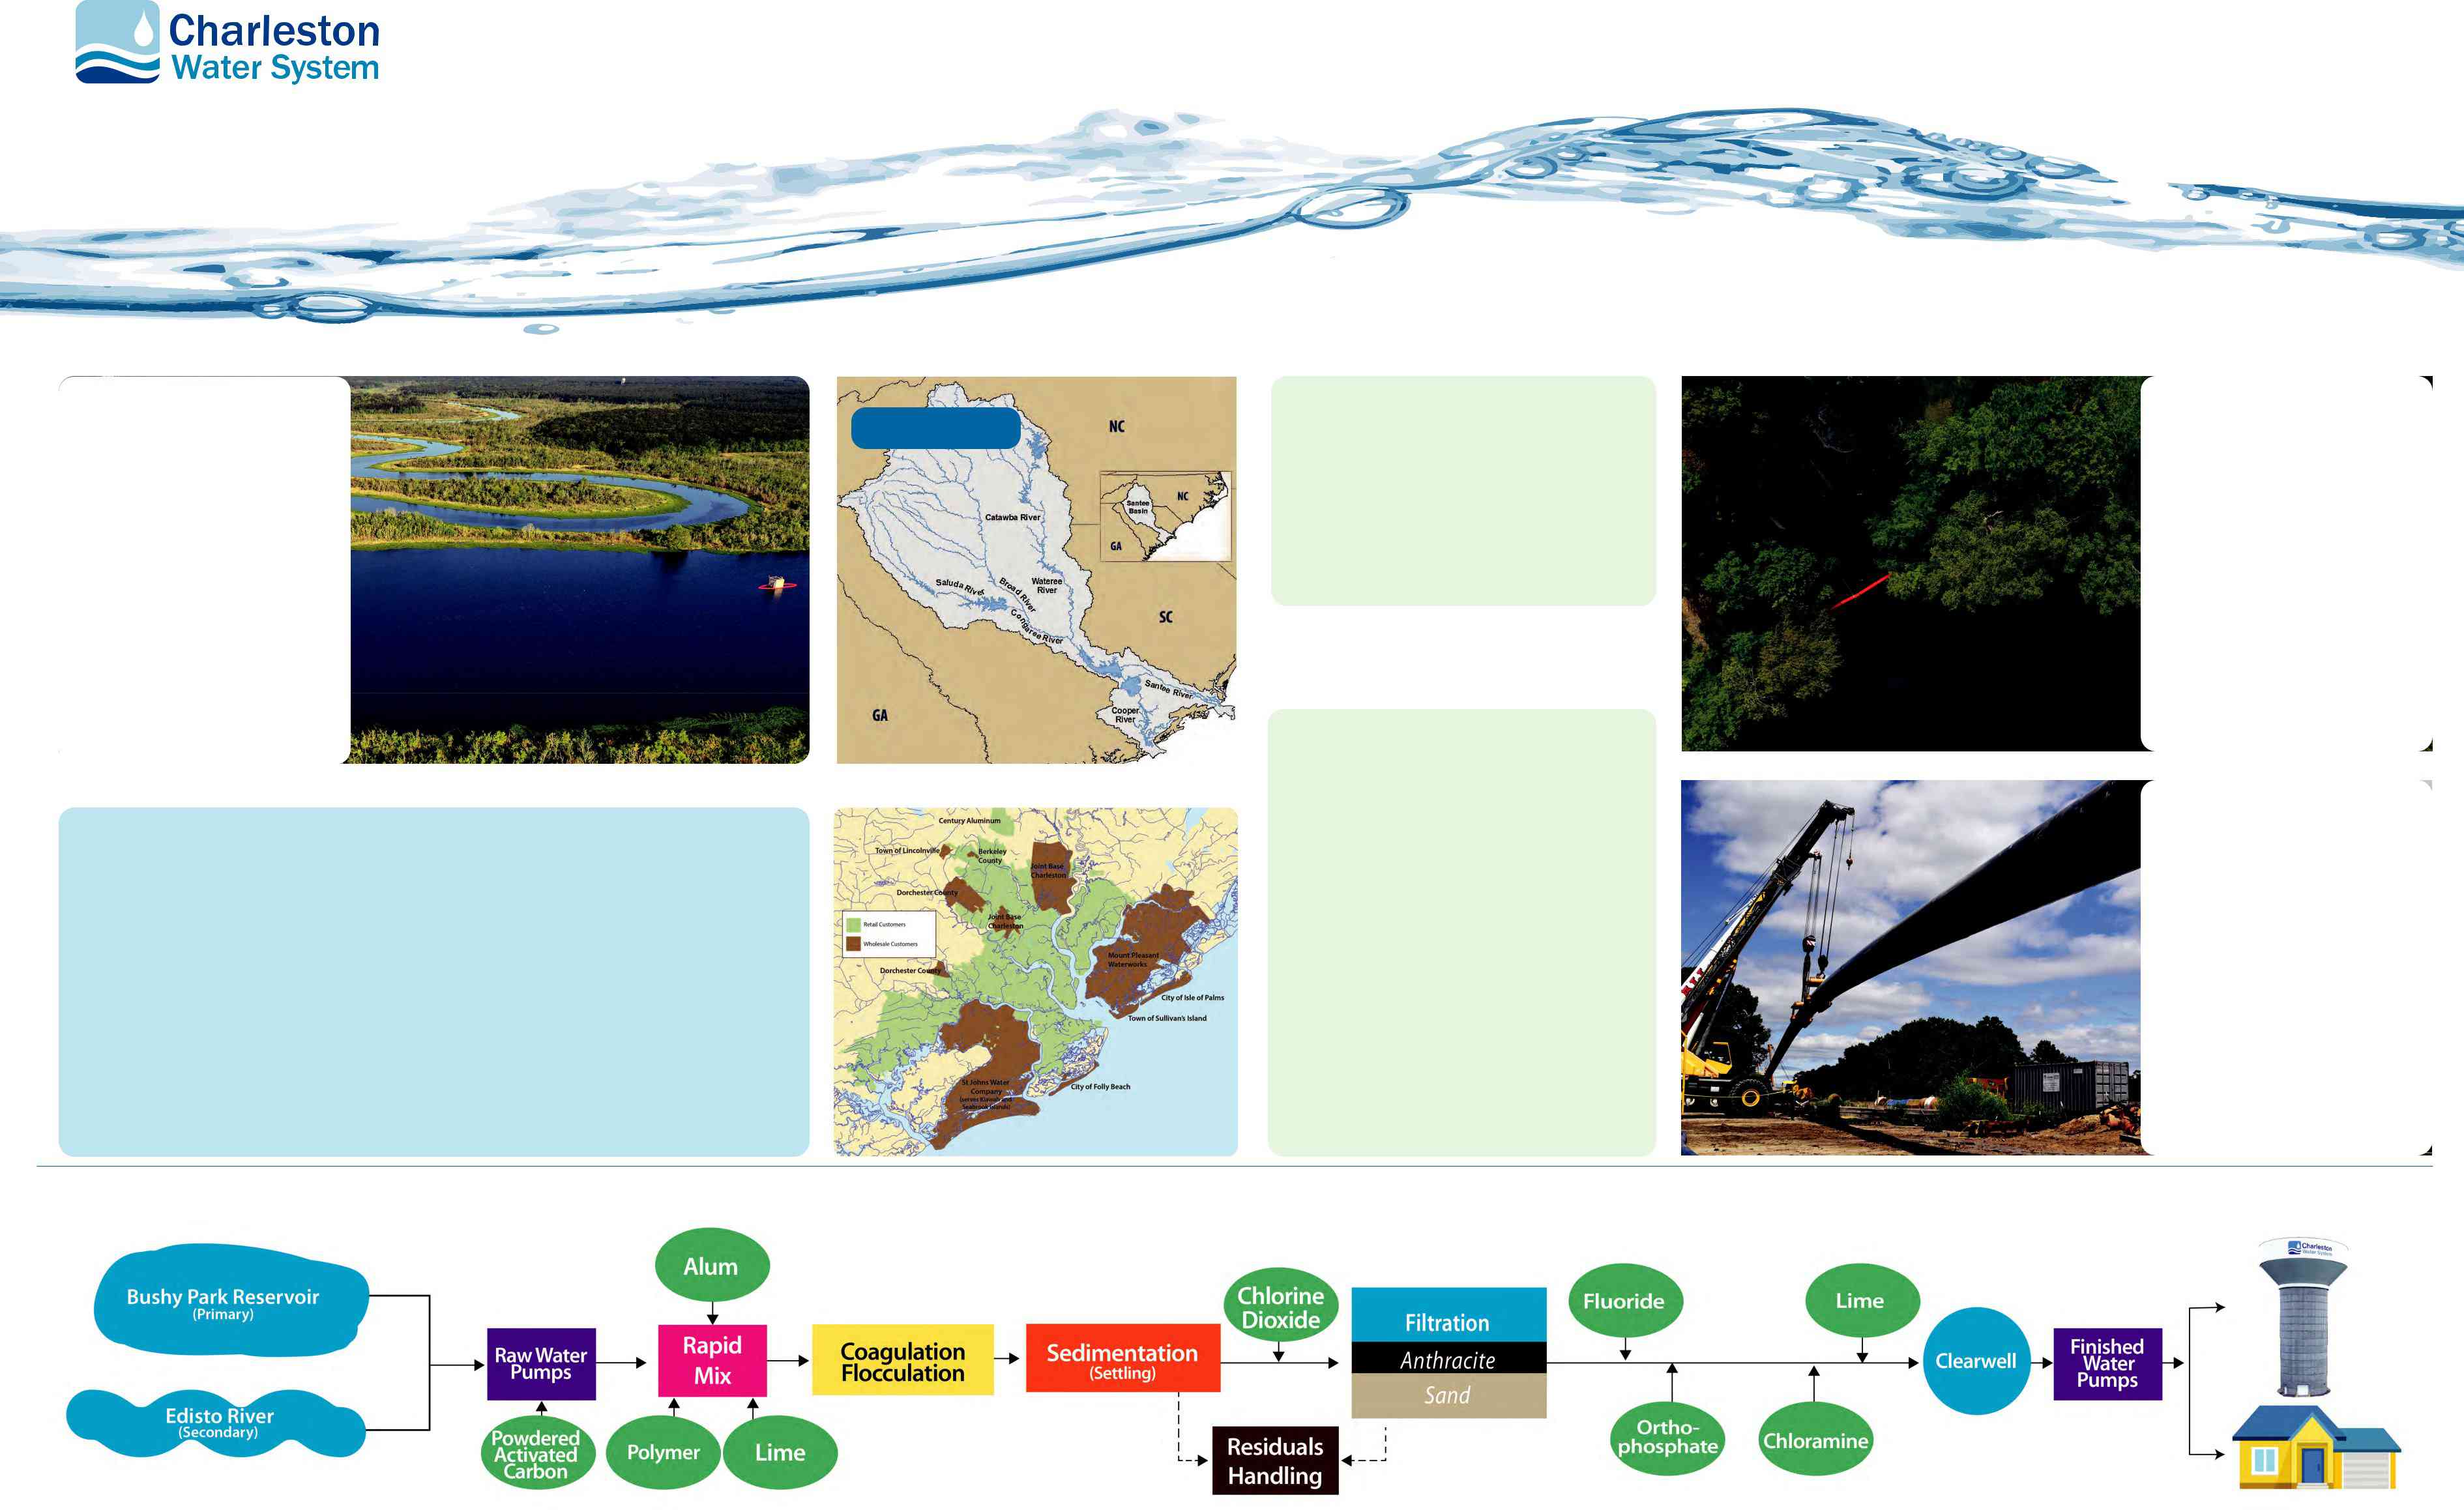
Hanahan Water Treatment Plant
BUSHY PARK RESERVOIR IS OUR PRIMARY WATER SOURCE |
BUSHY PARK RESERVOIR WATERSHED |
MESSAGE FROM THE EPA |
EDISTO RIVER IS OUR SECONDARY WATER SOURCE |
Source Water Protection
To raise awareness about preventing water pollution, SC DHEC identifies potential sources of contamination for each drinking water source in the state. www.scdhec. gov/environment/your-water-coast/ source-water-protection
You Can Help
Pick up the poop! Pet waste adds bacteria and excess nutrients, which contribute to algae growth that chokes out plants and wildlife.
Don’t over-fertilize your lawn. It washes into storm drains, streams, rivers and oceans.
No dumping in storm drains. They empty directly into a waterway.
Proper disposal of oils, paints, and chemicals.
BY THE NUMBERS
- Largest water treatment plant by permitted capacity in S.C.
- Wholesale customers
1,850 Miles of water mains
10,500 Fire hydrants
20,000 Total annual water quality tests
37,000 Water valves
$40,000 Spent since 2017 on voluntary unregulated compound testing 123,000 Retail customer accounts
450,000 People served in the tri-county area
64 MGD Average daily volume of treated water
105.5 MGD Largest recorded volume treated in one day
115.4 MGD DHEC permitted capacity
MGD = Million Gallons Per Day
2nd largest watershed on the east coast
WATER SERVICE AREA
Some people may be more vulnerable to contaminants in drinking water than the general population. Immuno- compromised persons, such as persons with HIV/AIDS or other immune system disorders, persons with cancer undergoing chemotherapy, persons who have undergone organ transplants, some elderly and some infants can be particularly at risk from infections.
These people should seek advice from their health care providers. EPA/CDC guidelines on appropriate means to lessen the risk of infection by Cryptosporidium and other microbial contaminants are available from the Safe Drinking Water Hotline (1-800-426-4791).
POSSIBLE CONTAMINANTS
IN SOURCE WATER
The sources of drinking water, both tap water and bottled water, include rivers, lakes, streams, ponds, reservoirs, springs, and wells.
As water travels over land and into waterways, it dissolves natural minerals and picks up substances from animals or human activity.
To protect public health, water treatment plants reduce contaminants to safe levels established by regulations.
Microbes, such as viruses and bacteria, may come from septic systems, livestock, pets and wildlife.
Organic compounds, including synthetic and volatile organics, which are by-products of industrial processes and petroleum production, can also come from gas stations, runoff, and septic systems.
Inorganic compounds, such as salts and metals, which can be naturally occurring or the result of storm water runoff, industrial or domestic wastewater discharges, oil and gas production, mining, or farming.
Radioactive compounds can be naturally occurring or the result of oil and gas production and mining activities.
Pesticides and herbicides may come from agriculture, runoff, and residential uses.
- Located in Givhans Ferry State Park
- Connected to Hanahan Water Treatment Plant by a 23 mile tunnel
-
In
2020-2021, we will spend $4.6 million to improve our intake structure
Adding and maintaining critical infrastructure is an important part of maintaining water quality all the way to customer taps!
Learn more about our capital improvements program at: www.charlestonwater.com/CIP
RawWater Sources |
(Coagulation/Clumping) |
TREATMENT PROCESS |
|
|
Storage |
|
|
|
|
|
|
|
Alum (aluminum sulfate) helps the |
|
|
(pH Adjustment |
|
|
impurities stick together to form |
(Disinfectant) |
(Dental Health) |
for stability) |
|
|
bigger particles called floc. Gentle |
|
|
|
|
|
mixing allows the floc particles to |
|
|
|
|
|
grow bigger and heavier. |
|
|
|
|
Sedimentation allows the large, heavy floc particles to settle to the bottom leaving the clean water on top.
(Taste & Odor Control) |
(Floc Aid) |
(pH Adjustment |
|
|
for stability) |
Filtration is a physical barrier that removes very tiny particles.
(Lead and Copper Control) |
(Long lasting |
|
|
disinfectant) |
Customers |
Contaminants
Charleston Water System
EWG's drinking water quality report shows results of tests conducted by the water utility and provided to the Environmental Working Group by the South Carolina Department of Health & Environmental Control, as well as information from the U.S. EPA Enforcement and Compliance History database (ECHO). For the latest quarter assessed by the U.S. EPA (January 2019 - March 2019), tap water provided by this water utility was in compliance with federal health-based drinking water standards.
Utility details
- Serves: 234333
- Data available: 2012-2017
- Data Source: Surface water
- Total: 18
Contaminants That Exceed Guidelines
- Bromodichloromethane
- Chloroform
- Chromium (hexavalent)
- Dibromochloromethane
- Dichloroacetic acid
- Total trihalomethanes (TTHMs)
- Trichloroacetic acid
Other Detected Contaminants
- 1%2C4-Dioxane
- Chlorate
- Dibromoacetic acid
- Fluoride
- Haloacetic acids (HAA5)
- Monobromoacetic acid
- Monochloroacetic acid
- Nitrate
- Nitrate and nitrite
- Strontium
- Vanadium
Reminder
Always take extra precautions, the water may be safe to drink when it leaves the sewage treatment plant but it may pick up pollutants during its way to your tap. We advise that you ask locals or hotel staff about the water quality. Also, note that different cities have different water mineral contents.
Sources and Resources
Sources Cited
Additional Resources
Charleston Tap Water
A new study in Charleston, South Carolina, has brought some doubt into the trustworthiness of the tap water in Charleston and the public’s confidence in the ability of those agencies to protect them. Researchers from the University of South Carolina studied the effects of five different types of disinfection methods on public drinking water. They found that all five showed a significant decrease in the number of bacteria and microbes in the water.
However, one of the disinfection methods that they tested produced an almost immediate increase in the number of microbes in the tap water. These increased microbes in the water were resistant to the disinfection methods they tried, indicating that they might increase the risk of people getting sick from the water that comes from their taps. This study is unsettling because it suggests no way to determine how much chance of getting sick from the tap water from a home or other drinking water source. This means that if a homeowner or business owner is concerned about getting sick from the water in their home, they have to take that worry into their own hands and install a home purifier or buy one of the many brands available for purchase that promise to remove any and all traces of illness-causing microbes.
Since Charleston has a long history of outbreaks of cholera and typhoid fever, researchers were also interested in understanding how outbreaks of those diseases might occur in the water supply. After testing the chlorination method, they found out that nearly half of the samples contaminated with bacteria had experienced an outbreak of one or more of those diseases. They concluded that chlorine levels in the water helped increase the likelihood of people catching these illnesses. The researchers recommended that all homes in Charleston use an ozone system along with the tap water filtration systems that they tested. They further recommended that the Charleston water authority install a home purifier that can specifically reduce the threat of bacteria and microbes from entering the water supply.
Drinking Water in Charleston
There is a big story brewing here in Charleston, West Virginia. I’d like to take this opportunity to tell you about it and ask you all sorts of questions about the people out there. The main thing that everyone needs to understand is that the drinking water we are all used to has been compromised. Since last week’s blog posting, new info has come to light regarding this new chemical recently found in the leaked bottled water in Charleston, WV, specifically, chlorine byproduct called Trihalomethanes or THMs. Many studies have been done around the country on the effects of this chemical, and they all show the same results: low levels of THMs in our drinking water but significant increases in cancer rates. This chemical is also a known carcinogen and is linked to reproductive problems and early death.
So, what does this all mean? It means that the drinking water supply that you’re probably used to has been intentionally placed at risk for contamination just so the bottled companies can make more money. While no one is saying that the Charleston area is trying to poison their customers, they expose them to a hazardous chemical. In addition to using this chemical to contaminate the Columbia River, bottled water companies add this cancer-causing chemical to almost every type of bottled water they sell.
This is not a joke. If this doesn’t wake up people across the United States, I don’t know what will. If you’re a Charleston resident, West Virginia, and you’re getting sick from your tap water, call your local water utility and ask them to put an emergency order with the National Drinking Water Act back in place. If you live in other parts of the united states, make sure that you voice your concerns to your state representatives as well so that you can protect yourself, your family, and the future of the human species.
Charleston Water Treatment
Charleston SC water treatment is done to treat the water in the Charleston area. If you live here, it is in your best interest to have your drinking water tested and treated by a professional treatment company. The testing done is to determine if there are any harmful chemicals or other pollutants in the water that could harm you or your loved ones. If there is, they can remove those from the water and make it safe for you to drink.
In Charleston, SC, water treatment services are available to the public, although not as many as you would think. Since this is a smaller city, the infrastructure isn’t as advanced as larger cities, so the ability for them to treat all of the water is less than what it could be. If you want some level of protection for your family, you should probably invest in a water treatment system. This will protect you and your family from getting sick from contaminated water with bacteria or other harmful materials that can cause sickness. You should also keep in mind that the water that seeps into your ground has to go somewhere, so if there are toxins in it, then the water has to go somewhere too.
Water treatment services come in a variety of methods. Some use carbon-based filtration to remove impurities in the water. Others use UV light to kill bacteria and other microorganisms. Still, others use various methods to ensure that the water you’re drinking or bathing in is the safest water possible.
Charleston Water Quality
As people have moved to Charleston, South Carolina, the city has consistently passed inspection withstanding tough national scrutiny as one of the healthiest cities in the United States for decades. Like many Southern cities, the water quality in Charleston is subject to harmful external influences from everything from industrial pollution to runoff from nearby rivers and lakes. Charleston water has long been among the best in the nation for both drinking and bathing water quality.
When you consider that the city of Charleston is located so close to the Ashley Pond, which is the second-largest man-made lake on the East Coast, it is no wonder that so much care is taken to ensure the quality of the water. With a long history as a popular fishing destination for residents and tourists, Charleston’s water is brimming with natural wildlife. From egrets to crappie to smallmouth bass and catfish, the water is home to an incredible variety of aquatic life that ranges in size from minuscule fish to bull sharks. In fact, experts have even noted that some rare sharks have been observed in the water of Charleston. This is good news for the Charleston SC water quality enthusiasts who love to watch the sharks but don’t want to risk their own life!
The water in Charleston is treated at four treatment plants, including two treatment facilities that specialize in sewage treatment. Treatment is often controversial in other areas of the country, and Charleston does experience opposition regarding the necessity of treatment. However, the Charleston SC water quality program works hard to ensure that all residents can enjoy clean, safe water. If you have been enjoying some good fish and great food in your local area, you need to check the water quality in Charleston before you leave.
Water System in Charleston
The city of Charleston in South Carolina is located on the banks of the Ashley River. Since Charleston has a large part of its water supply from the Ashley river, it is no wonder that the water system in Charleston, SC, is one of the best in the country. You can find everything you need to run your water system with ease in Charleston, including everything from water softeners to filtration systems and everything in between. In fact, if you wanted, you could even choose to build your own water system in Charleston. This article will discuss some great reasons you should look into making your own water system for your household. First, we will discuss what kind of water system you would need in Charleston, SC.
Before you start building water systems in Charleston, you have to first get a water system plan designed by a professional to have a clear idea as to what kind of system you are going to use. People use many different types of techniques for water systems, but they all serve the same purpose, which is to bring clean, purified water into your house or building. The problem with using bottled water is that the government mandates that every bottle has to be tested to ensure it is potable and free of chemicals. This makes it very expensive to keep buying new bottles, and it is also hard to monitor the water supply that way.
There are many water systems that you can use around your home, but the main thing that you want to consider is how well the water is monitored. If the water is hard, it can lead to a wide range of water problems such as mold, spots on your appliances, and pipes and can even make your laundry smell terrible. On the other hand, if your water system is soft, you will never have to worry about these problems. You will always have fresh, clean, purified water to rely on whenever you need it. This is one of the primary reasons people love water systems because they are much more reliable and expensive to maintain over time.
Treatment Plant in Charleston
Charleston has some great options if you want to get a treatment plant started or expand a treatment plant into a larger one. Three of the best are Cherry Grove, Summerville, and Hanahan’s Island. The Cherry Grove plant is located right on the water at the intersection of exits 16 and 33, and the town’s most giant power plant, the Cape Fear Power Plant, is located in the area. The closest treatment plant is at the Cherry Grove airport, which is about a three-mile drive away. If you would prefer to have immediate service from a treatment plant rather than wait for a while, Summerville is the place to go. It is only about a two-mile drive from the Cherry Grove airport.
Hanahan’s Island has an excellent connection to the water. You can also connect directly to the wastewater treatment plant if that’s what you need. Your treatment plant will be a few miles away from the wastewater treatment plant and a few miles from Hanahan’s Island as well. In addition to having connections to the water and wastewater treatment plants, Hanahan also has a septic tank that can store excess sewage.
There are many reasons you might choose a septic system over a single-stage wastewater treatment plant. If your water isn’t pristine enough to support a large sewage treatment plant, you can add a second stage later. Additionally, if your water source is contaminated, you don’t want to put a lot of stress on the existing infrastructure. All in all, there are many advantages to septic tanks, and the city of Charleston should take notice.
Charleston Water Utility
The last time I came to Charleston, SC, which is in the state of South Carolina, the city government had just installed a new water utility company that will provide some great features for their customers. The city has gone through significant improvements in water and sewer services over the past couple of years, and it is now one of the best cities to live in. It’s located right in the heart of Charleston Harbor, so you don’t have to worry about having your pipes or electricity run through the city. Now when you go out to the waterfront in the summertime, you can enjoy the water with a beach in the background. The utility company, Hydro, has done a tremendous job improving the city’s water quality, and it offers all kinds of incentives to residents who want to have a high-speed internet connection at home.
Hydro, the name of the water utility company, was founded in 1969 and has provided excellent service to Charleston’s city. They use the latest technology to keep their customers satisfied by using only the cleanest and purest water. If you’re one of the many residents who want a high-speed internet connection at home, you should look into signing up for one of their packages. In one of their packages, you will get a telephone with a digital voice feature and free Internet service. You will also get telephones with digital video recorders and other neat features.
The hydroelectric plant at Wild Dunes is one of the largest ones in the country. Now you won’t have to worry about your water being polluted because they take every step necessary to ensure it is safe. The city has an emergency power system that automatically kicks in during emergencies, so you will never have to worry about your utilities being cut off in the middle of the night. When looking for a high-speed Internet service provider, you will want to give Hydro one of your top considerations. They offer packages to meet just about everyone’s needs.